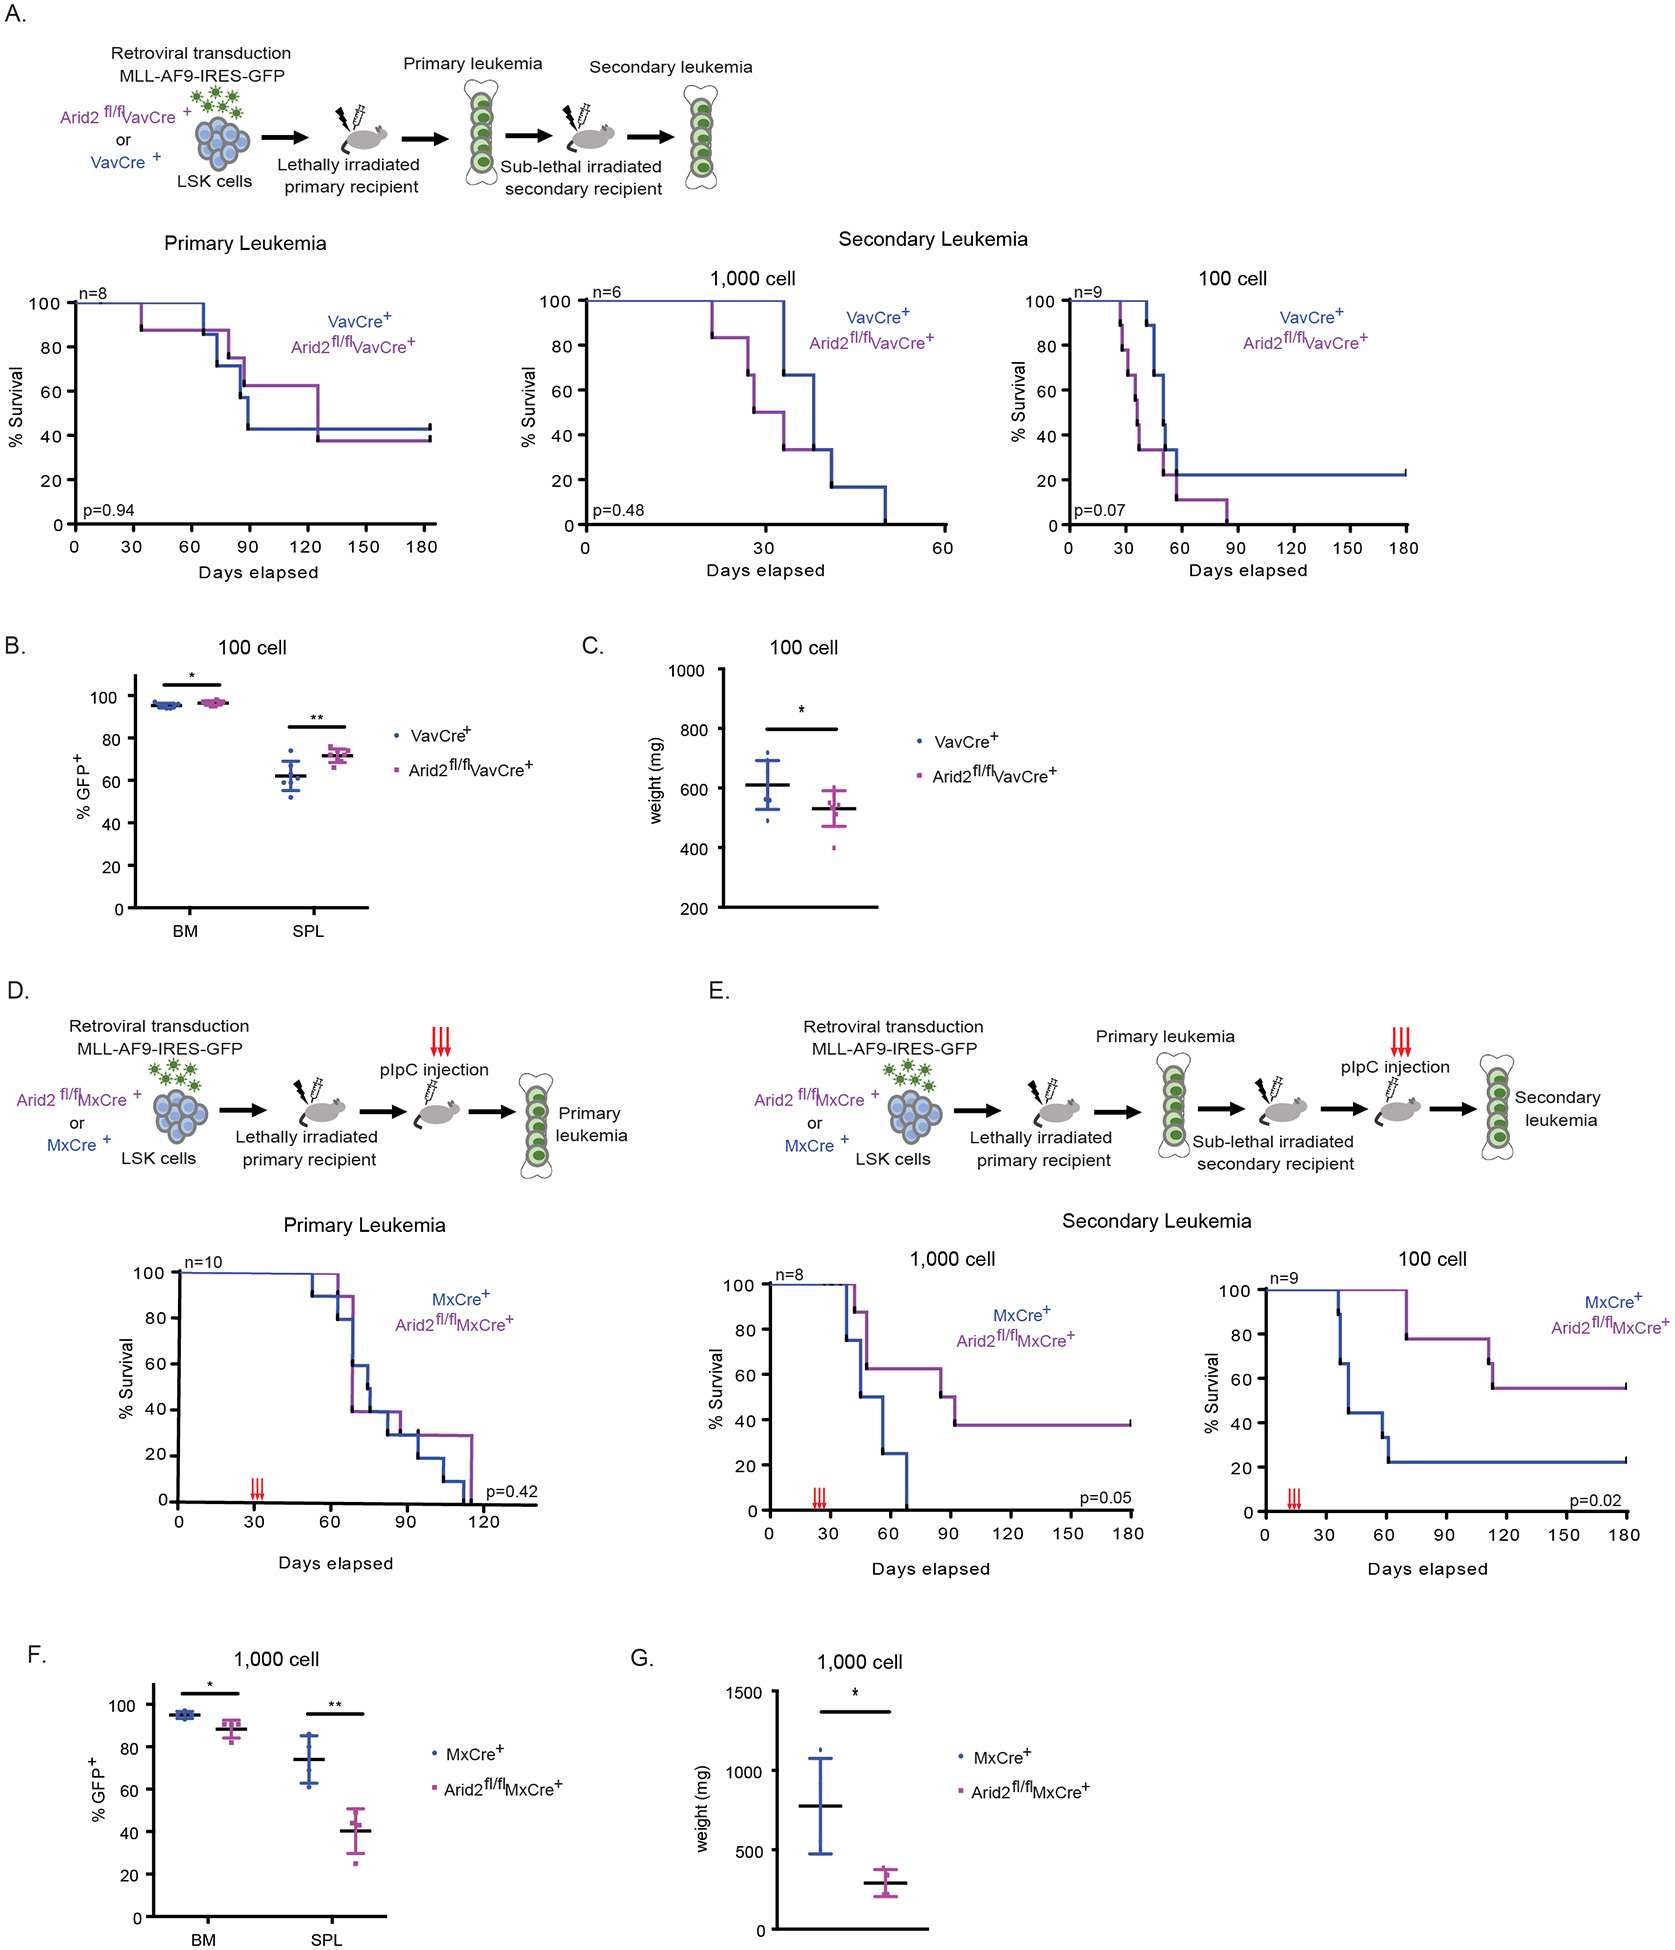
Figure 2. Arid2 has dual roles in MLL-AF9 leukemogenesis.

(A-C) In vivo leukemogenesis upon the loss of Arid2 in the VavCre mouse model. (A) Experimental scheme (top). Survival curve of primary recipient mice (bottom, left). Survival curves of secondary recipient mice (bottom, right). (B) Percent of GFP+ cells in the BM and SPL of moribund recipients in the 100 cell secondary cohort. (C) SPL weight of moribund recipients in the 100 cell secondary cohort. (D-G) Leukemia maintenance upon the loss of Arid2 utilizing the MxCre mouse model. (D) Experimental scheme of the primary leukemia (top). Survival curve of primary recipient mice (bottom). pIpC was administered at 30 days post transplantation. (E) Experimental scheme of the secondary leukemia (top). Survival curves of secondary recipient mice (bottom). pIpC was administered at day 21 (1000 cell) and day 14 (100 cell). (F) Percent of GFP+ cells in the BM and SPL of moribund recipients in the 1,000 cell secondary cohort. (G) SPL weight of moribund recipients in the 1,000 cell secondary cohort. n=recipient mice per genotype. VavCre model LSK donors n=2. MxCre model LSK donors n=2. Survival curve p value calculated using log-rank test. p-value *< 0.05, **< 0.01, ns, not significant, un-paired, parametric t-test, error bars indicate s.d.
