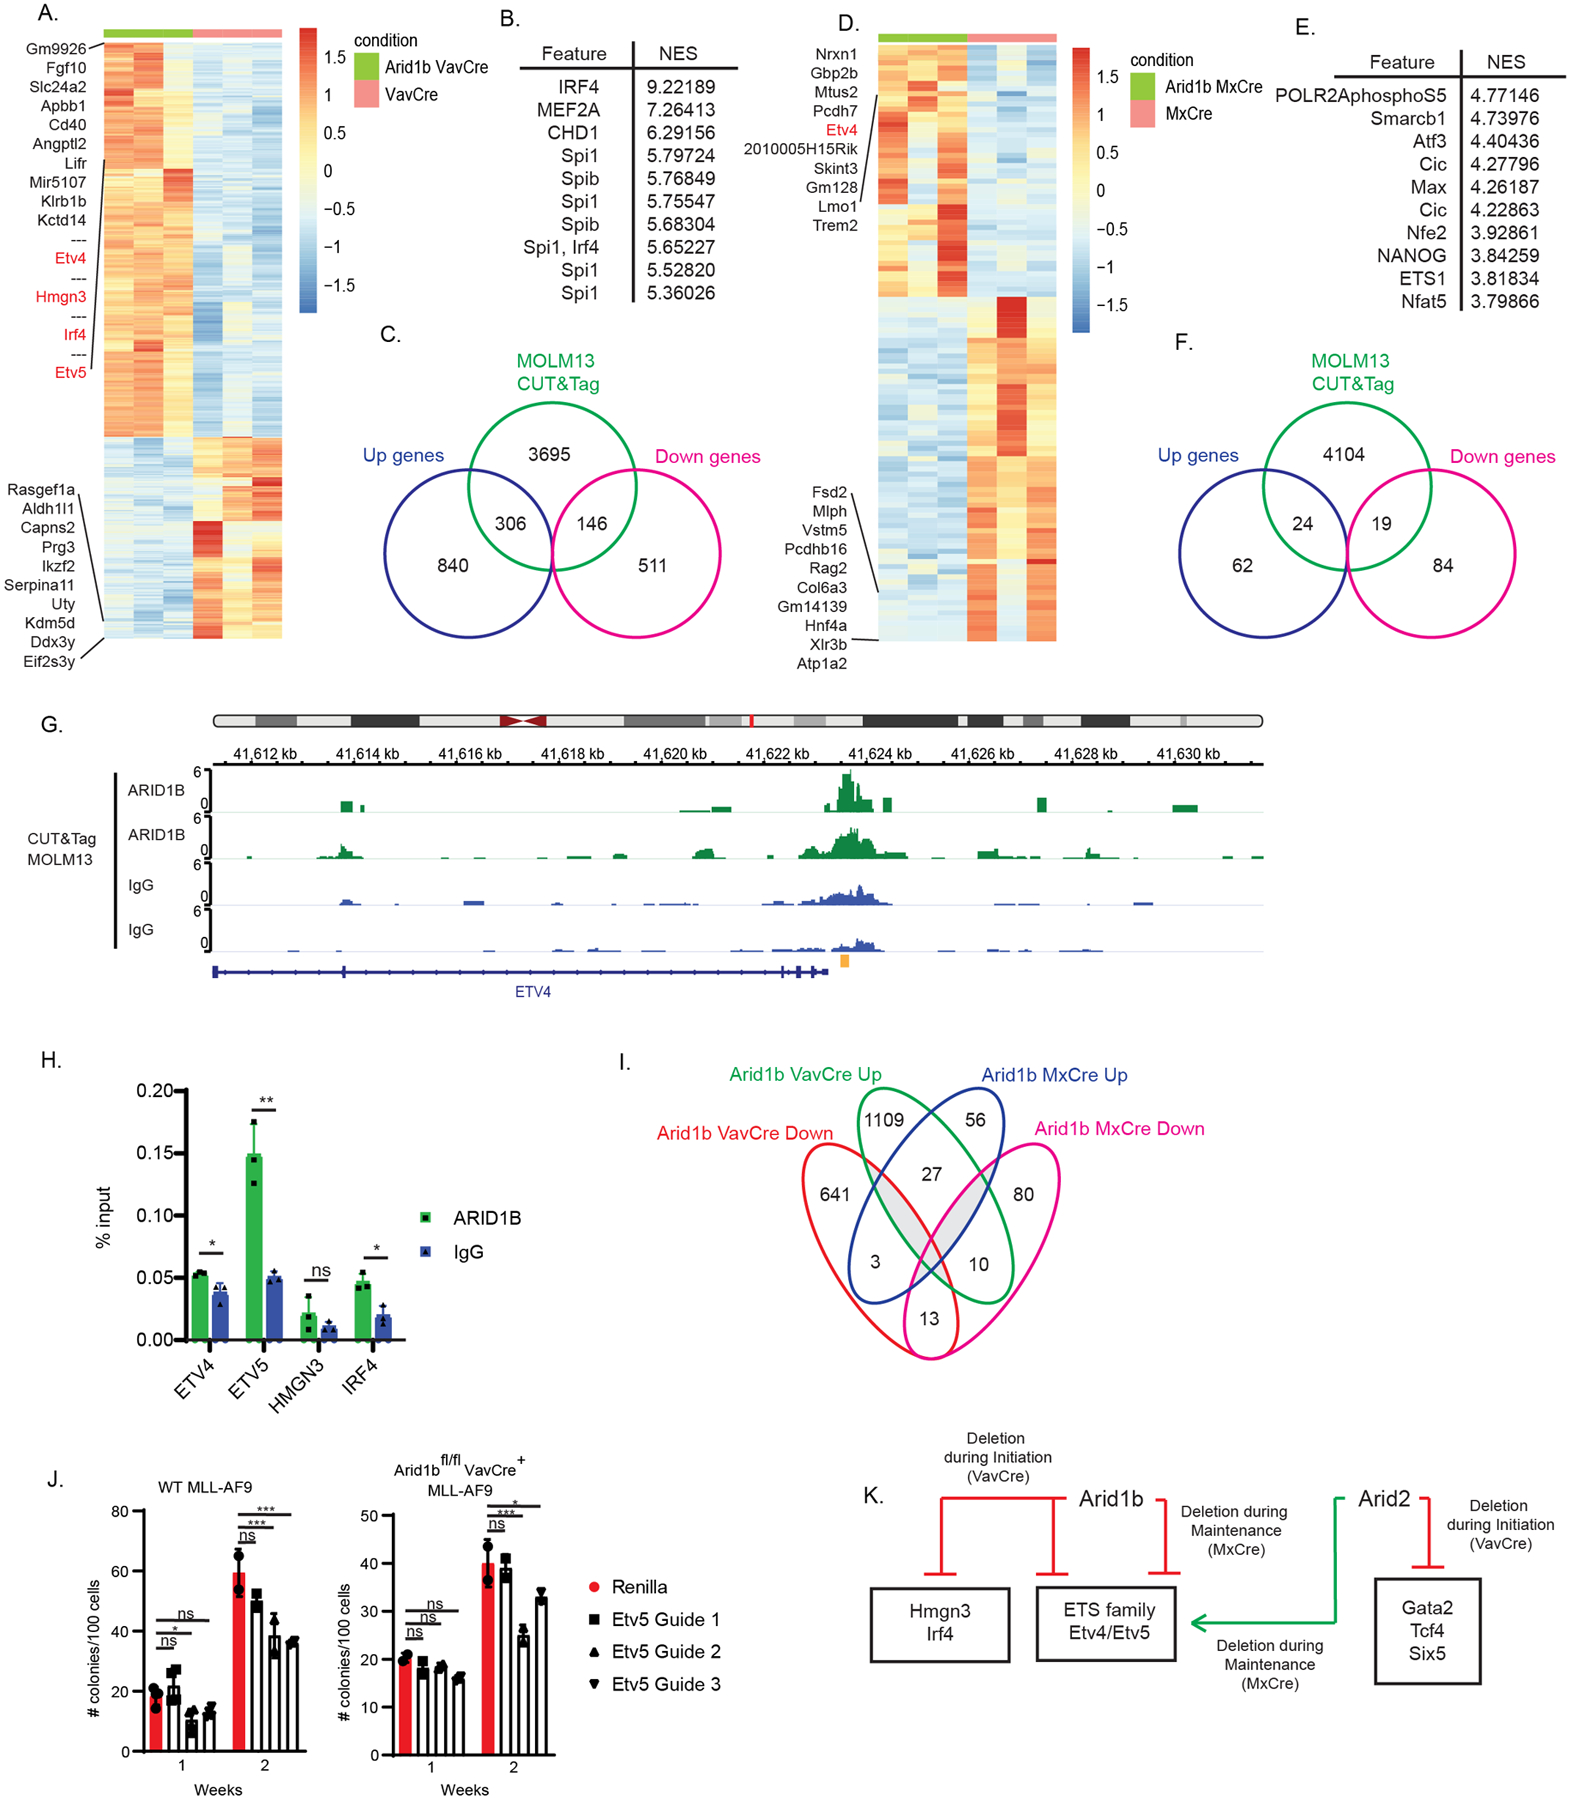
Figure 6. Transcription factors regulated by Arid1b in leukemogenesis.

(A) Heatmap of differentially expressed genes between Arid1bfl/fl VavCre and VavCre secondary recipient whole BM leukemia cells. Color scale for heatmaps correspond to the gene(row) Z-score. (B) Top 10 overrepresented transcription factor motifs within the top differentially up regulated genes (+1.5 log fold change; adj. p<0.05) (C) Venn diagram showing overlap between significant differentially expressed genes (+/−1.5 fold change; adj. p<0.05) identified in the Arid1bfl/fl VavCre RNA-seq and peaks called in ARID1B MOLM13 CUT&Tag. (D) Heatmap of differentially expressed genes between Arid1bfl/fl MxCre and MxCre secondary recipient whole BM leukemia cells. Color scale for heatmaps correspond to the gene(row) Z-score. (E) Top 10 overrepresented transcription factor motifs within the top differentially up regulated genes (+1.5 log fold change; adj. p<0.05) (F) Venn diagram showing overlap between significant differentially expressed genes (+/−1.5 fold change; adj. p<0.05) identified in the Arid1bfl/fl MxCre RNA-seq and peaks called in ARID1B MOLM13 CUT&Tag. (G) IGV tracks of ARID1B CUT&Tag in MOLM13 cells at the ETV4 promoter locus. Yellow indicates ChIP-qPCR amplicon in H. (H) ChIP-RTqPCR of ARID1B or IgG control in MOLM13 cells. p-value *< 0.05, **<0.01, ns, not significant, un-paired, parametric t-test, error bars indicate s.d. (I) Venn diagram showing overlap of the significant differentially expressed genes (+/−1.5 fold change, adj. p<0.05) between Arid1b VavCre and Arid1b MxCre. (J) MLL-AF9 colony formation of wildtype cas9 expressing MLL-AF9 single cell clone (left) and Arid1bfl/flVavCre+ MLL-AF9 cells from secondary transplant recipient in methylcellulose transduced with Renilla (control) or CRISPR guides targeting the ETS domain of Etv536. Colonies were counted 7 days after plated (week 1) followed by replating (week 2). p-value *< 0.05, ***<0.001, ns, not significant, two-way ANOVA with multiple comparisons, error bars indicate s.d. (K) Model. Prominent transcription factor networks regulated by Arid2 and Arid1b in MLL-AF9 leukemogenesis. Boxed transcription factors are bound by Arid2 and Arid1b respectively.
