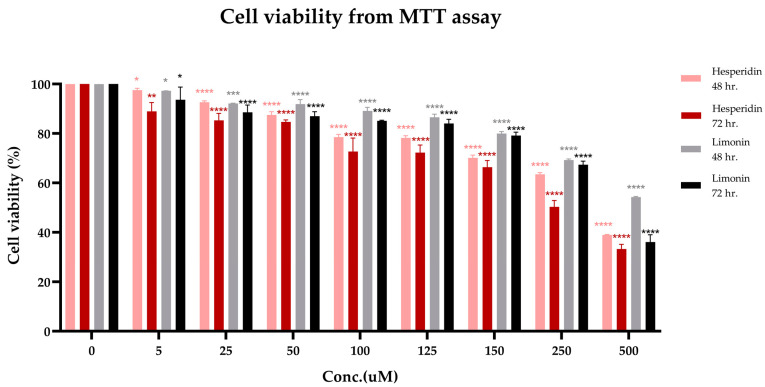
Figure 3.
Cell viability (from MTT assay) of PLC/PRF/5 human hepatocellular carcinoma cells treated with hesperidin for 48 h. (pink bars), 72 h. (red bars) and limonin for 48 h. (grey bars), 72 h. (black bars). The statistical differences were separately analyzed for limonin and hesperidin by using one-way ANOVA followed by the Bonferroni comparisons test. The symbol *, **, *** and **** mean p < 0.05, <0.01, <0.001 and <0.0001, respectively, compared with the negative control (0.5% DMSO).

