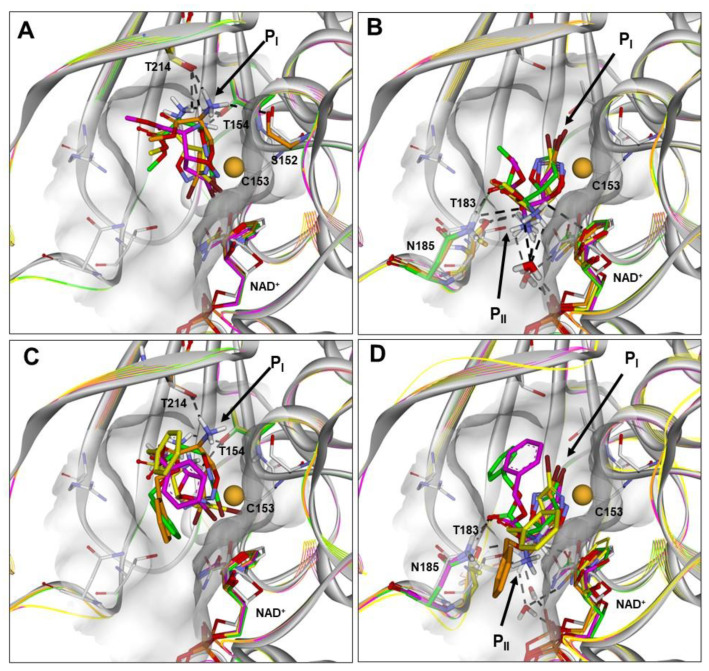
Figure 3.
(A–D) Docked structures of PfGAPDH in complex with: (i) 2a (orange), 2b (yellow), 2c (green), and 2d (magenta) approaching from the PI site (BA1; A) or PII site (BA2; B); (ii) 3a (orange), 3b (yellow), 3c (green), and 3d (magenta) approaching from the PI site (BA1; C) or PII site (BA2; D). All structures are superimposed on the starting PfGAPDH conformation by fitting Cα atoms. The starting protein conformation (gray) is displayed as solid ribbons and the Connolly surface of the active site is shown. The backbone of the docked complexes is in line ribbons, key interaction residues are displayed and labeled, and heteroatoms are colored by atom type (N, blue; O, red; S, yellow; Br, brown). The van der Waals volume of the sulfur atom of C153 is scaled by 50%. Hydrogen atoms are omitted for clarity, except those involved in ligand–protein hydrogen bond interactions (black dashed lines).

