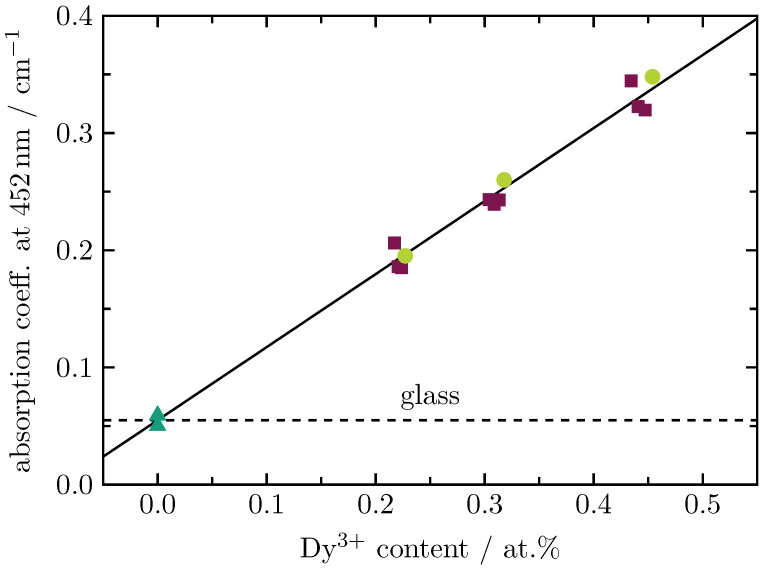
Figure 4.
Total absorption coefficient at 452 nm versus Dy content for Dy (full circles) and Tb (full triangles) single-doped as well as Dy/Tb (full squares) double-doped BaB glasses. The solid line represents a least squares fitting to the experimental data. The glass background is indicated by the dashed line.

