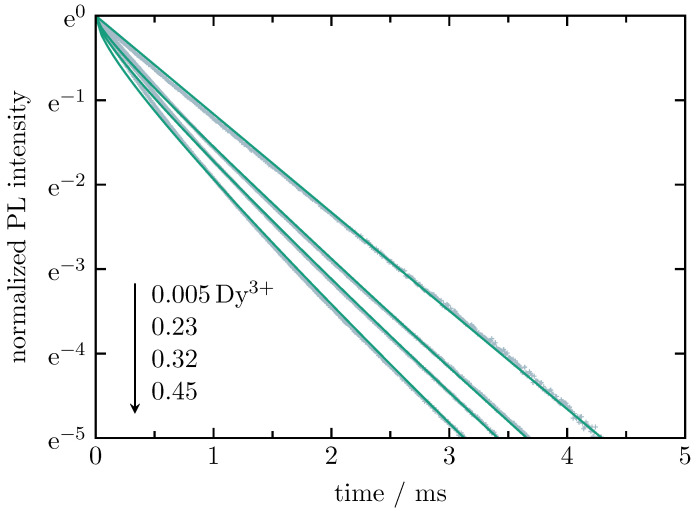
Figure 10.
Normalized radiative decay curves of Dy in Dy single-doped BaB glass with varying Dy contents (all values are in at.%), recorded for the Dy-related F to H transition at 575 nm under 455-nm excitation. The solid curves (green) represent the best fit on the basis of the Inokuti–Hirayama model with the multipolar interaction parameter, S, set to 6 (dipole–dipole interaction).

