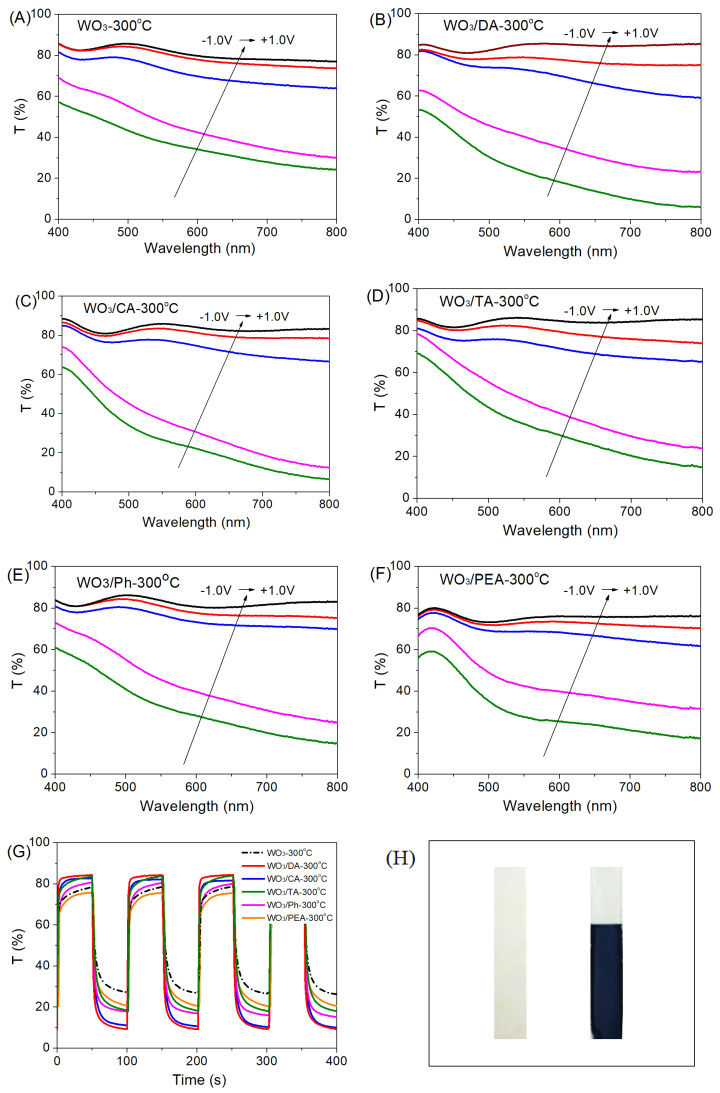
Figure 7.
UV-vis transmittance spectra at different potentials of (A) pure WO3-300 °C, (B) WO3/DA-300 °C, (C) WO3/CA-300 °C, (D) WO3/TA-300 °C, (E) WO3/Ph-300 °C, and (F) WO3/PEA-300 °C films at the potentials of −1.0, −0.8, +0.5, +0.8 and +1.0 V, as shown in green, violet, blue, red and black lines, respectively, (G) switching curve comparison between the WO3-300 °C, WO3/DA-300 °C, WO3/CA-300 °C, WO3/TA-300 °C, WO3/Ph-300 °C, and WO3/PEA-300 °C films at λ720nm (+1.0 V/−1.0 V, 100 s per cycle), and (H) the photo of the WO3/DA-300 °C films in the bleached and colored states respectively.

