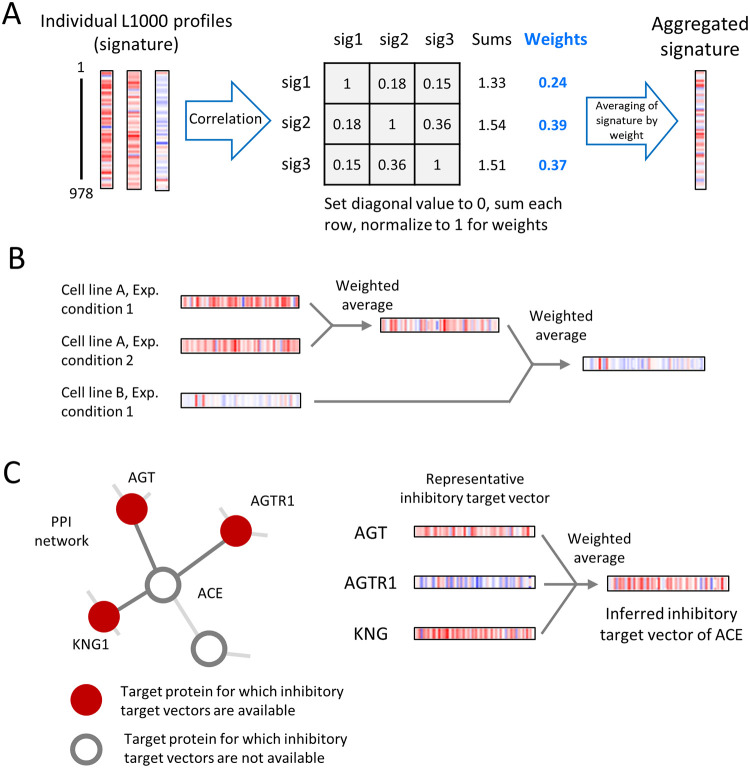
Fig 2. Schematics of aggregation and inference for a genetically perturbed transcriptome.
(A) Weighted averaging for combining individual signatures into consensus gene signatures. Individual profiles were weighted by the sum of their correlations to other individual signatures and then averaged. (B) Generation of target vectors by cross-perturbation and cross-cell line aggregation. Multiple signatures measured after the same genetic perturbation in a specific cell, but with different perturbational doses or times, were first aggregated by weighted averaging. The same procedure was performed between multiple signatures measured after the same genetic perturbation in different cell lines. (C) Examples of inferring target vector representation. AGT, AGTR1, and KNG1 interacted with ACE in the PPI network, and their inhibitory target vectors were available. The inhibitory target vector of ACE was inferred by aggregating these three representative inhibitory target vectors using weighted averaging.

