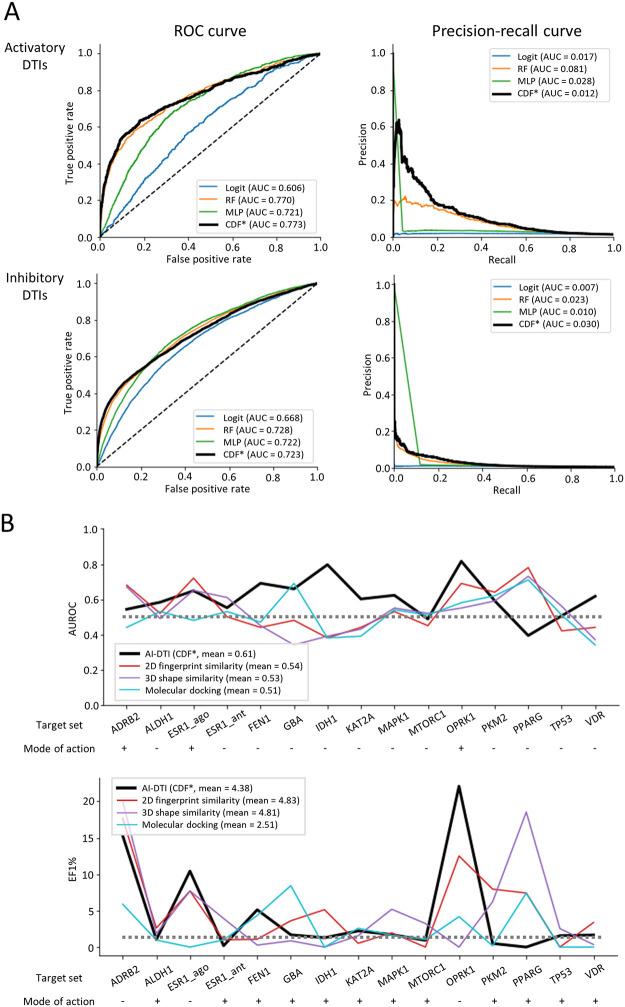
Fig 4. Assessment of performance on independent datasets.
(A) Performance curves for activatory (top) and inhibitory (bottom) DTIs on the DrugBank dataset. *CDF model with 8 estimators in each cascade layer and 500 trees in each forest. Logit, logistic regression; RF, random forest; MLP, multilayer perceptron. CDF, cascade deep forest. (B) Performance comparison between our optimized model and the conventional virtual screening methods on LIT-PCBA. * CDF model with 8 estimators in each cascade layer and 500 trees in each forest.

