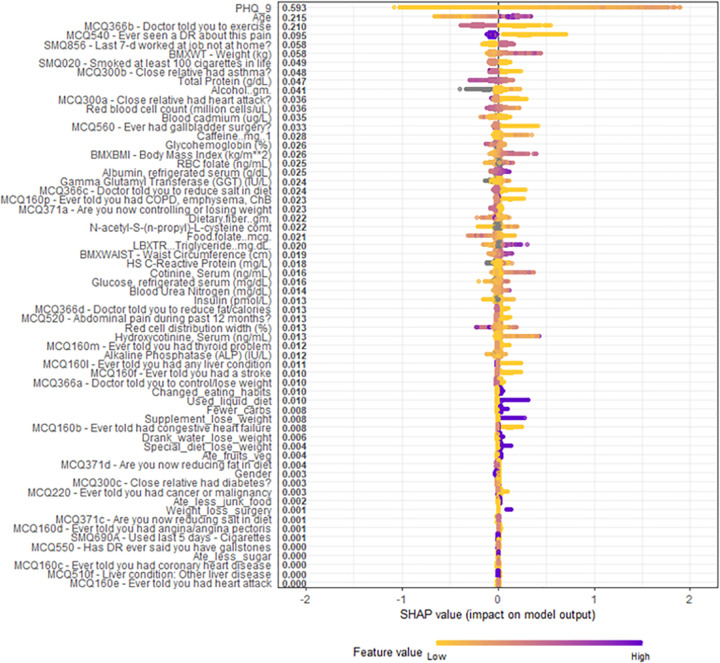
Fig 5. Overall SHAP explanations.
SHAP explanations, purple color representing higher values of the covariate while yellow representing lower values of the covariate. X-axis is the change in log-odds for a sleep disorder. Covariates ordered according to the Gain statistic. Covariates with SMQ or MCQ labeled in front of it were asked the question written; responses were numeric (integer number) for SMQ and binary (yes, no) for MCQ. Abbreviations: DR = Doctor.

