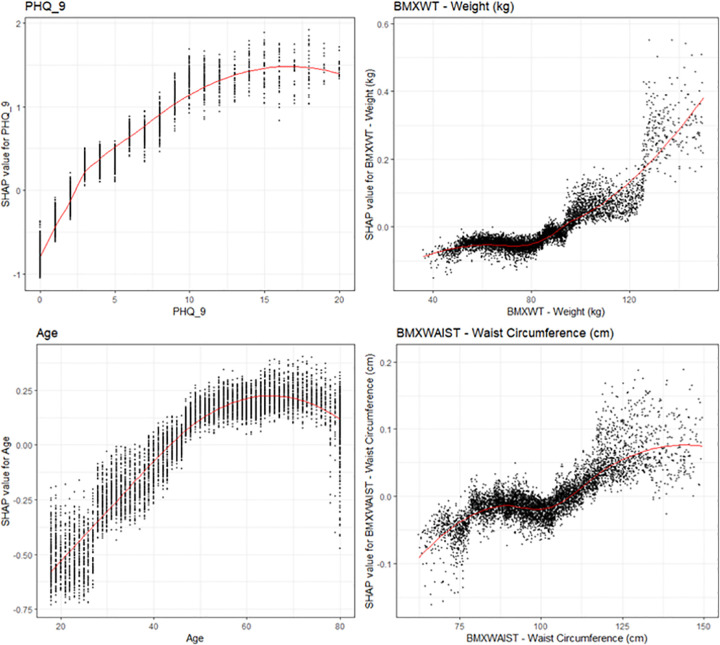
Fig 6. SHAP explanations for the Top 4 continuous covariates.
SHAP explanations, covariate value on the x-axis, change in log-odds on the y-axis, red line represents the relationship between the covariate and log-odds for CAD, each black dot represents an observation. Covariates: top left–PHQ-9, top right–Body weight, bottom left–patient age, bottom right–waist circumference.

