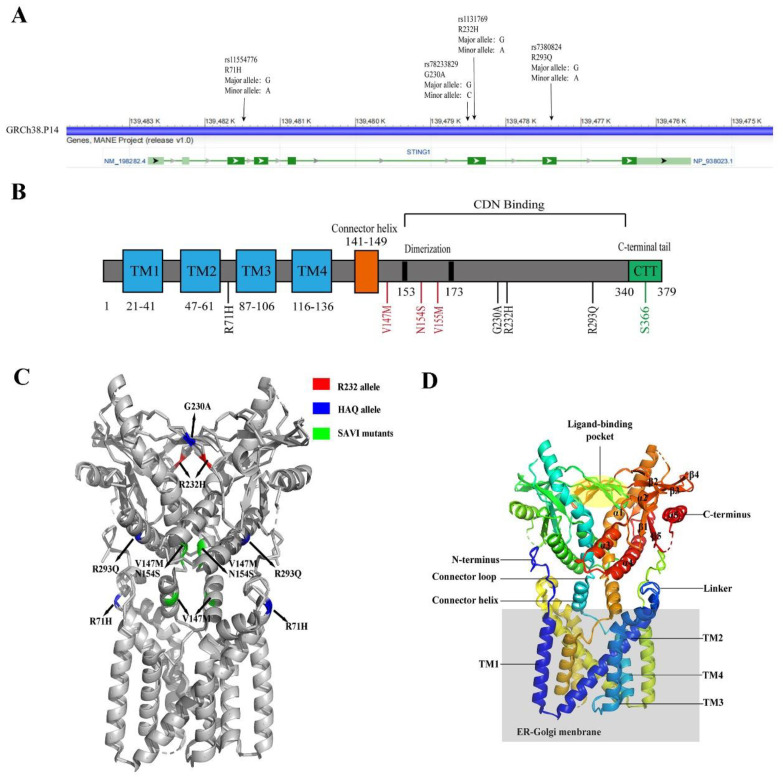
Figure 2.
The structure of hSTING. (A) The hSTING gene map (NCBI reference sequence: NC-000005.10), annotated with common SNPs. (B) Schematic diagram of the hSTING protein domain. Transmembrane domains are marked in blue, common human mutation points are marked in black, regions related to IRF3 activation are marked in green, and SAVI mutation points are marked in red. (C) The crystal structure of the hSTING protein (PDB: 7SII). R232 is marked in red, the HAQ mutation point is marked in blue, and the SAVI mutation point is marked in green. (D) Representation of the STING structure (PDB: 7SII). The secondary protein structure, N-terminus, and C-terminus are numbered. The ER–Golgi membrane is colored in gray.

