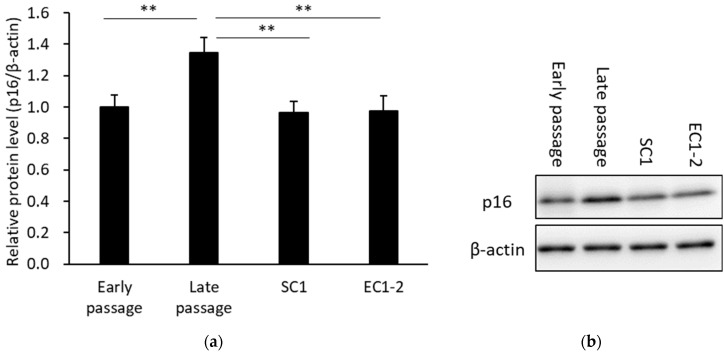
Figure 3.
Effects of SC1 and EC1-2 on the cellular senescence marker p16 (a). The relative protein level of p16 normalized with β-actin is evaluated by western blotting. Representative western blot images of p16 and β-actin are shown (b). Data were reported as means ± SD of three independent experiments. **; p < 0.01 vs. Late passage group by Dunnett’s test.

