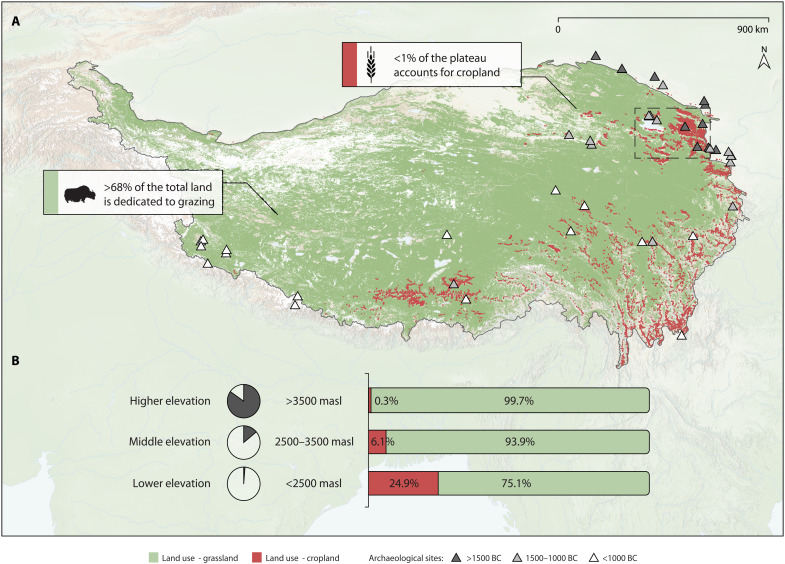
Fig. 1. The distribution of modern land use on the Tibetan Plateau.
(A) Map shows the distribution of modern grassland/pasture (green) and cropland (red) (text S1). The dashed square shows the study region of the barley hypothesis paper (9). Triangles display published sites with domesticated animal remains for different time periods (dataset S1). (B) Left: Percentage of total land area constituted by different elevation ranges on the plateau. Right: Relative proportion of modern cropland and grassland at different elevations of the plateau (table S1).

