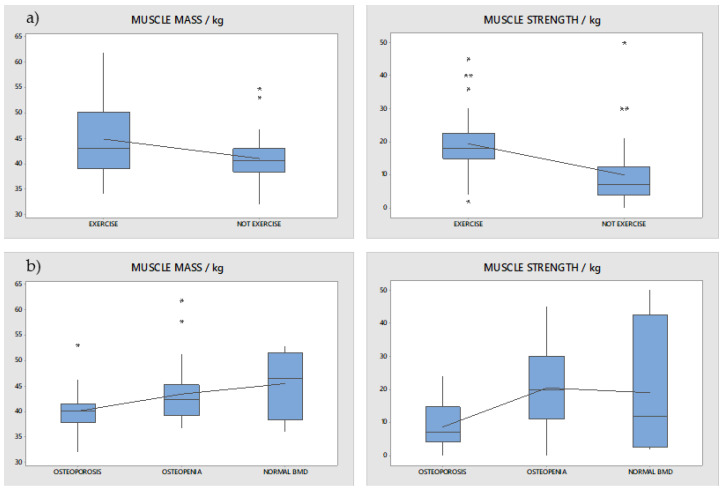
Figure 3.
Differences in muscle mass and muscle strength: (a) between patients that performed exercises and patients that did not perform exercises (p = 0.010); (b) between patients with osteoporosis, osteopenia, and normal BMD (p = 0.000). Asterisks represent mild outliers (data points that are more extreme than Q1 − 1.5 IQR or Q3 + 1.5 IQR).

