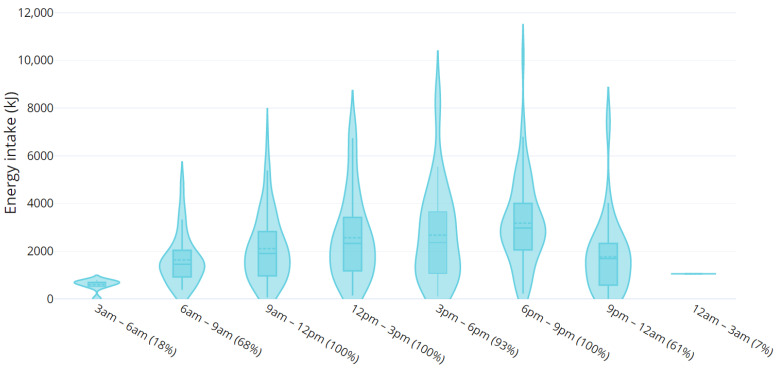
Figure 1.
Energy intake across the day. Distribution of energy intakes during 3 h intervals across the day and the percentage of participants who reported at least one eating/drinking occasion within each 3 h interval. The bulbous section(s) in each column represents the area(s) of highest density of reported energy intakes with energy intakes reported by fewer participants represented as thin/less bulbous areas of each column. The percentage represents the proportion of participants reporting consuming energy during that time period.

