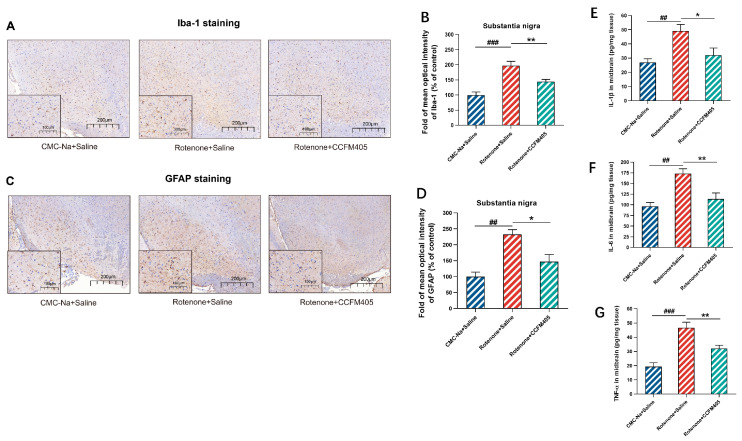
Figure 4.
Effects of L. plantarum CCFM405 on microglia and astrocytes in the SN region of the brain in rotenone-challenged PD mice. (A) Representative images of Iba-1 immunohistochemistry in the SN of mouse brain; Scale: 200 μm. (B) Average optical density analysis of Iba-1 positive cells in the SN region of mouse brain (n = 3/group); (C) representative images of GFAP immunohistochemistry in the SN of mouse brain; Scale: 200 μm. (D) Average optical density analysis of GFAP positive cells in the SN of mouse brain; Scale: 200 μm (n = 3/group); (E–G) the concentration of IL-1β, IL-6 and TNF-α in the midbrain of PD mice (n = 8/group). Data are means with SEM. ## p < 0.01, ### p < 0.001 signs Rotenone+Saline group vs. CMC-Na+Saline group; * p < 0.05, ** p < 0.01, signs Rotenone+CCFM405 group vs. Rotenone+Saline grup.

