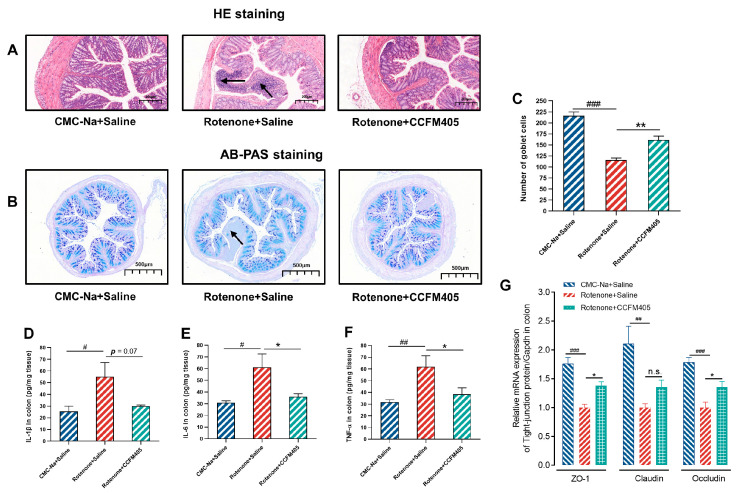
Figure 5.
Effects of L. plantarum CCFM405 on intestinal inflammation and goblet cell count in the colon in rotenone-induced PD mice. (A) Representative images of H&E staining in the colon; the black arrows show inflammatory cell infiltration (n = 3/group); (B) representative images of AB-PAS staining of the colon (n = 5/group); (C) the number of goblet cells in the colon; (D–F) the concentration of IL-1β, IL-6, TNF-α in the colon (n = 8/group); (G) relative expression of colonic tight junction protein mRNA (n = 4/group). Data are means with SEM. # p < 0.05, ## p < 0.01, ### p < 0.001 signs Rotenone+Saline group vs. CMC-Na+Saline group; * p < 0.05, ** p < 0.01 signs Rotenone+CCFM405 group vs. Rotenone+Saline grup. “n.s.” means there was no noticeable difference between the groups.

