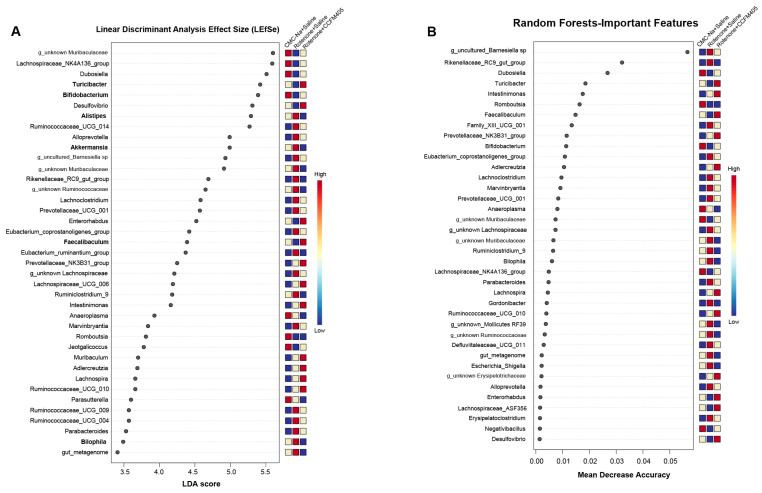
Figure 7.
The general difference and determination of specific bacteria for discrimination among the three groups. (A) The linear discriminant analysis effect size (LEfSe) for three groups, with marked genera ranked in descending order by LDA value and a heatmap displaying matching genera that are either higher (red) or lower (blue); (B) the thirty-five most predictive genera were filtered by random forest classifier with feature importance scores. Feature importance was determined by calculating the mean decrease in model accuracy that resulted from randomly shuffling its values, n = 10/group.

