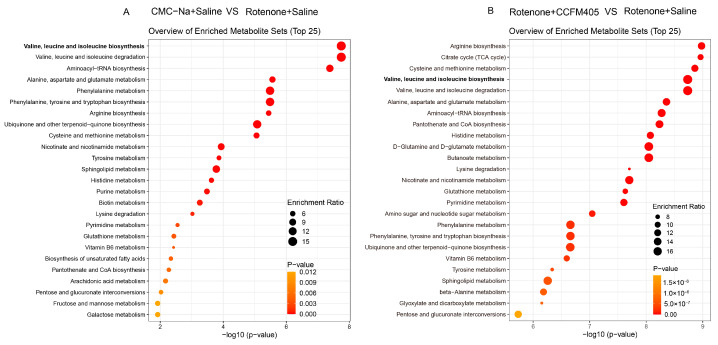
Figure 10.
Metabolic pathway enrichment analysis of differential fecal metabolites. (A) Normal control versus PD group; (B) L. plantarum CCFM405 group versus PD group. The color of the histogram represents the metabolic enrichment pathways with significant differences. The size of the dots in the left panel means the enrichment rate, n = 10/group.

