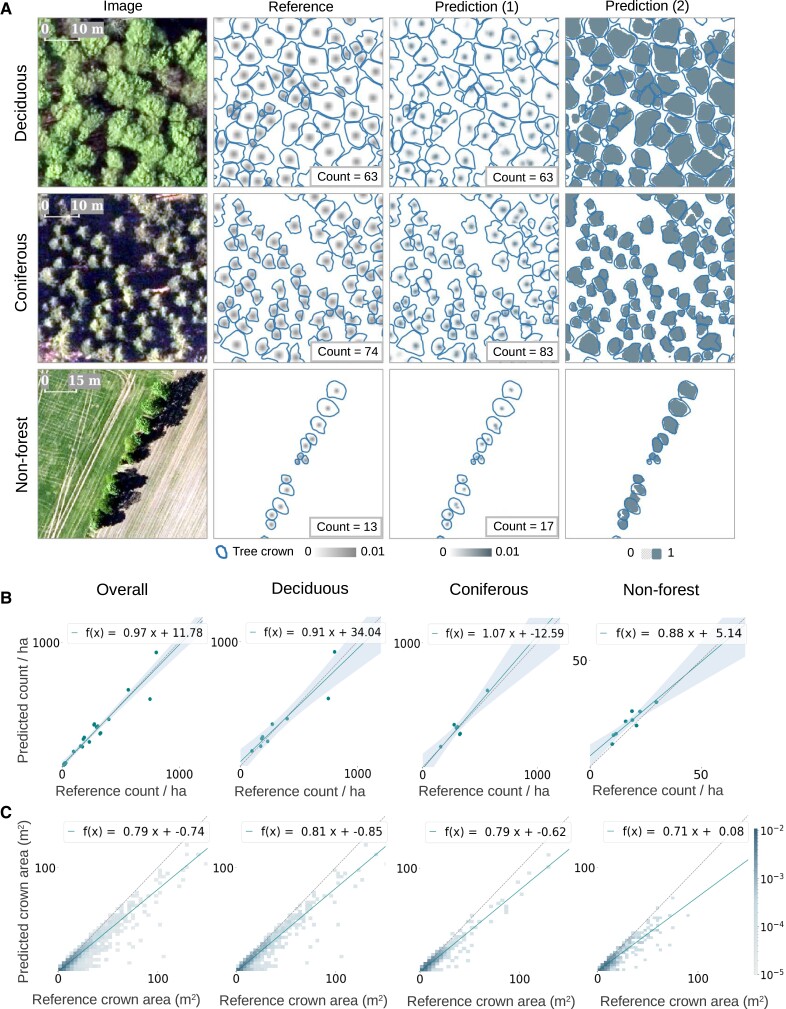
Fig. 3.
Individual tree counting and crown segmentation performance on the test data set. A) Examples from three different forest/landscape types: deciduous forest, coniferous forest, and nonforest areas. Reference shows the target labels, including the manual crown delineations (solid lines) and the Gaussian-blurred crown centroids (center dots). Prediction (1) shows the counting by density estimation results, and prediction (2) shows the crown segmentation results, both overlaid with the manual delineations (solid lines). B) Evaluation of the tree counts from prediction (1), grouped in respective landscape types and rescaled to tree counts per hectare. Here, each scatter point in the plots represents a sampling image of varying sizes ranging between 0.07 and 6.7 ha (see details in the main text). The regression lines are shown in solid and the identity lines are shown in dotted. C) Evaluation of the tree crown area predictions from prediction (2) at individual tree-level accuracy.

