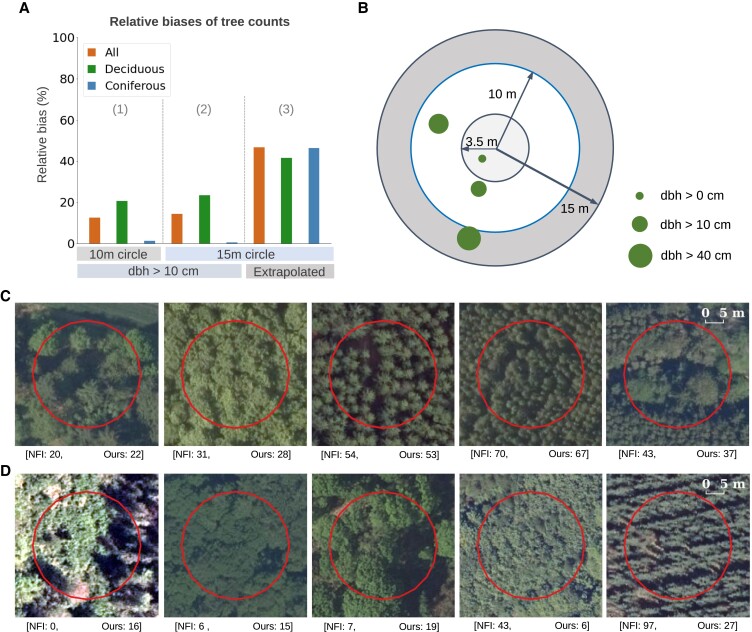
Fig. 5.
Plot-level evaluation of tree count prediction against NFI field plots. A) Relative biases of tree counts were evaluated in three ways by comparing predicted tree counts against the following: (1) all trees (dbh > 10 cm) in the 10-m radius plots; (2) all trees (dbh > 10 cm) in the 15-m radius plots; and (3) all trees taller than 1.3 m (trees below this minimum height were not measured by the NFI), where the numbers of smaller trees not measured exhaustively on the field were extrapolated by the NFI. Biases were calculated for all plots, plots with deciduous trees, and plots with coniferous trees, separately. Absolute bias values are displayed for clear visualization. B) Design of the Danish NFI. Each field plot consists of three concentric circles with a radius of 3.5, 10, and 15 m. Trees taller than 1.3 m are measured exhaustively in the inner circle (3.5-m radius), trees with dbh > 10 cm are measured exhaustively in the middle circle (10-m radius), and trees with dbh > 40 cm are measured exhaustively in the entire circle (15-m radius). The NFI extrapolates trees of all sizes to all circles, assuming a homogeneous distribution. C) Examples of tree counts from NFI and our predictions with low bias. Here, the NFI counts refer to the number of trees (dbh > 10 cm) in the 15-m circle. D) Examples of tree counts from NFI and our predictions with high bias.

