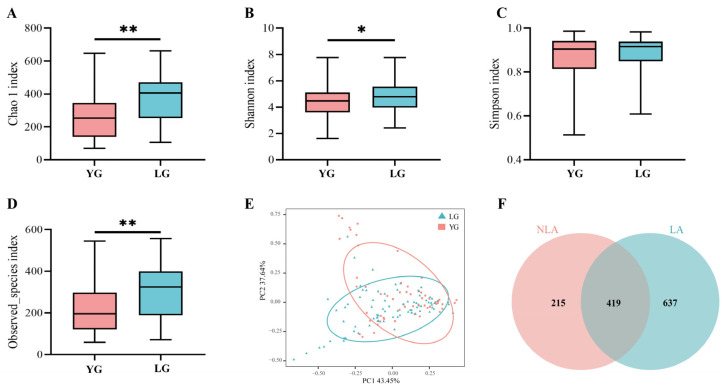
Figure 1.
Characteristics of gut microbiota in Changshou District, Guangxi. (A–D) Comparison of α-diversity of intestinal microflora based on Chao1, Simpson, Shannon, and observed species index between LG and YG groups in Guangxi longevity area over 90 years of age. * indicates p < 0.05, and ** indicates p < 0.01 (Wilcoxon rank-sum test). (E) indicates principal component PCA analysis between LG longevity and YG groups. (F) OTU Venn diagram between longevity area (LA) and non-longevity area (NLA). (F) Ensemble plot showing the number of OTUs for each age group in the longevity area.

