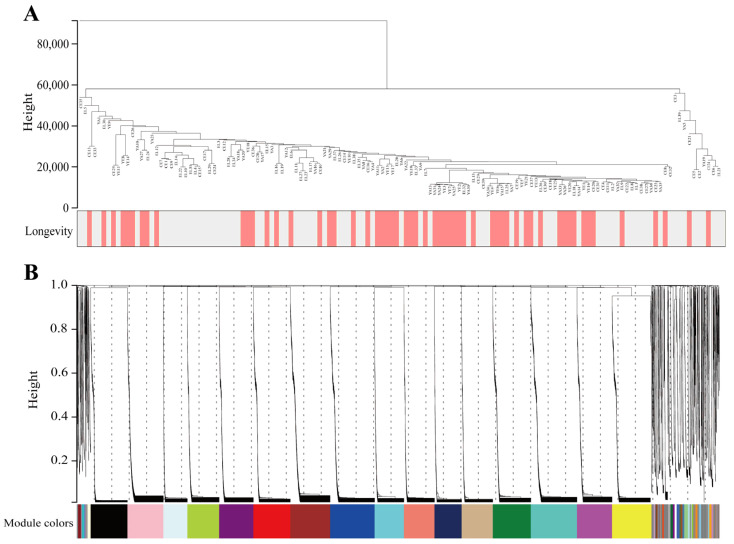
Figure 2.
Construction of microecological co-expression modules. (A) Dendrograms and heatmaps of traits for 135 samples obtained from the longevity area. Colours indicate the proportion of traits, including longevity (age older 90 years) and sex. (B) Cluster dendrogram of OTUs. The branches above represent OTU clusters based on differences in topological overlap and the Colours of the assigned modules.

