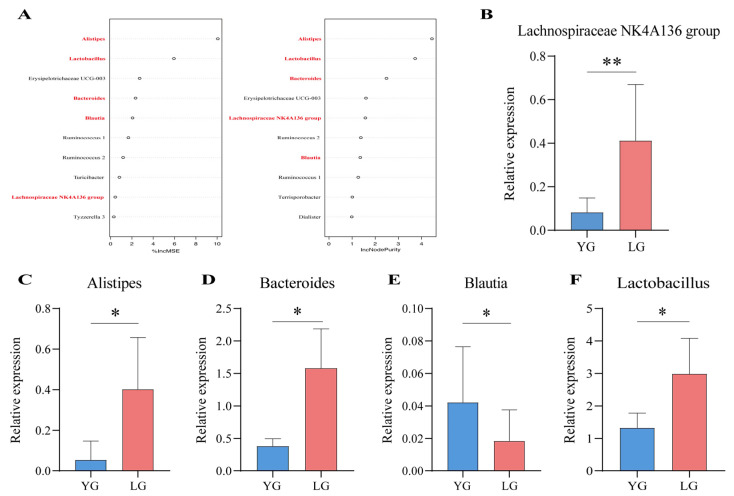
Figure 4.
Random forests and differential gene expression identify key genera in the longevity core module. (A) Random forest prediction of iconic longevity taxa within the module and ranking of top 10 importance based on longevity phenomena, with taxa in bold indicating that they are also present in the top 10 results for network-centric colonies in the core module. On the left-hand side of the figure, the increase in mean-squared-error (IncMSE) ranking is indicated, and on the right-hand side the increase in node purity (IncNodePurity) is indicated, with higher values of %IncMSE as well as IncNodePurity indicating higher importance of the variable. (B–F) Results of qPCR relative expression tests for key gut microbiota, with both YG and LG groups using non-longevity area seniors as controls. (B) indicates Lachnospiraceae NK4A136 group, (C) indicates Alistipes, (D) indicates Bacteroides, (E) indicates Blautia, and (F) indicates Lactobacillus. * indicates p < 0.05 and ** indicates p < 0.01.

