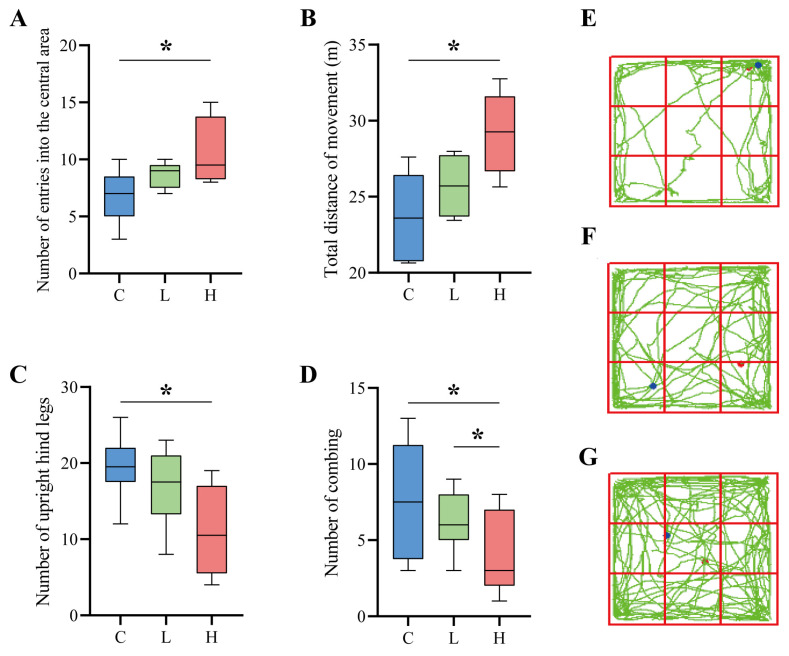
Figure 5.
Results of the open-field experiment. (A–D) Parameters of the open field experiment. (A) indicates the number of times the mice entered the central area of the open field, (B) indicates the total distance the mice moved in the open field, (C) indicates the number of times the mice stood upright on their hind limbs during the open field experiment, (D) indicates the number of times the mice groomed during the open-field experiment; * indicates p < 0.05. (E–G) In the open field experiment, there are behavioural pathways of mice, with red dots in the diagram indicating the starting point and blue dots showing the endpoint. (E) denotes control group C, (F) denotes low-dose group L, and (G) denotes high-dose group H.

