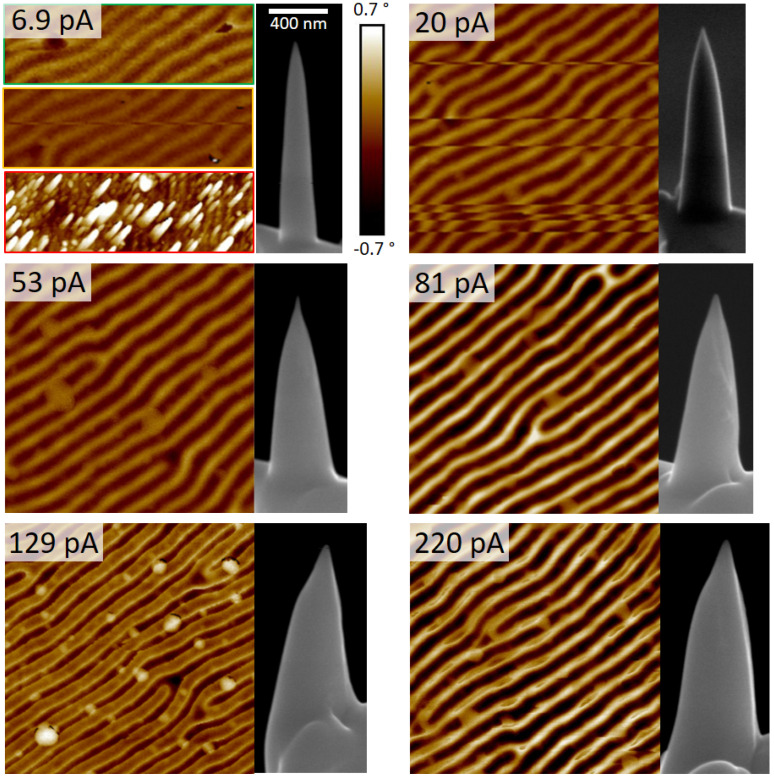
Figure 4.
wide MFM phase maps of the CoPt multilayer sample, imaged with α-pillars of similar heights, fabricated at , while was varied from . For lowest currents, the MFM performance was very unstable, as shown by three representative images on the top left. The right SEM images show the respective Co3Fe probes; the scale bar of 6.9 pA applies to all.

