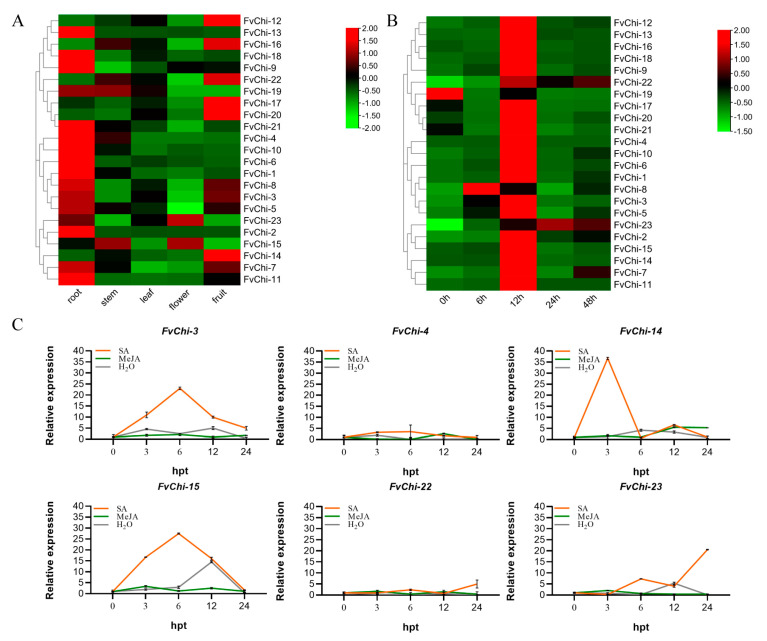
Figure 6.
FvChi gene expression profiles in different tissue/organs and response to C. gloeosporioides inoculation and hormones treatment by qRT-PCR. (A) FvChi gene expression in different tissue/organs including root, stem, leaf, flower, and fruit. (B) FvChi gene expression profiles in response to C. gloeosporioides inoculation. (C) FvChi gene expression profiles in response to SA, MeJA, and water treatments. Red and green color scale denotes high and low expression levels, respectively. Error bars indicate the standard deviation (SD) of three biological replicates.

