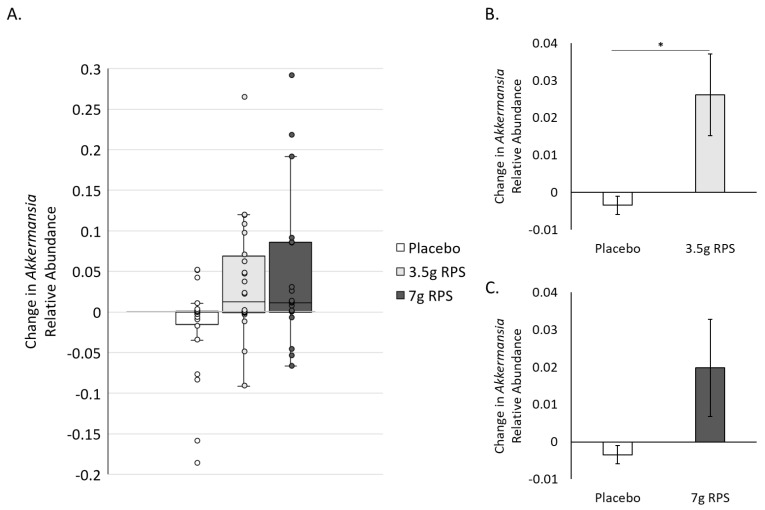
Figure 3.
Increases in the relative abundance of Akkermansia after 4 weeks in response to placebo, 3.5 g RPS, or 7 g RPS. (A) Box and whisker plots revealing interquartile range (IQR; box), median (line inside box), and 1.5 times the IQR (error bars), as well as individual data points (circles). (B) The increase in the relative abundance of Akkermansia was significantly higher in the 3.5 g RPS group compared to the placebo arm (p = 0.014). (C) The increase in the relative abundance of Akkermansia was not significantly higher in the 7 g RPS group (p = 0.056) compared to the placebo arm (Student’s t-test, * p < 0.05).

