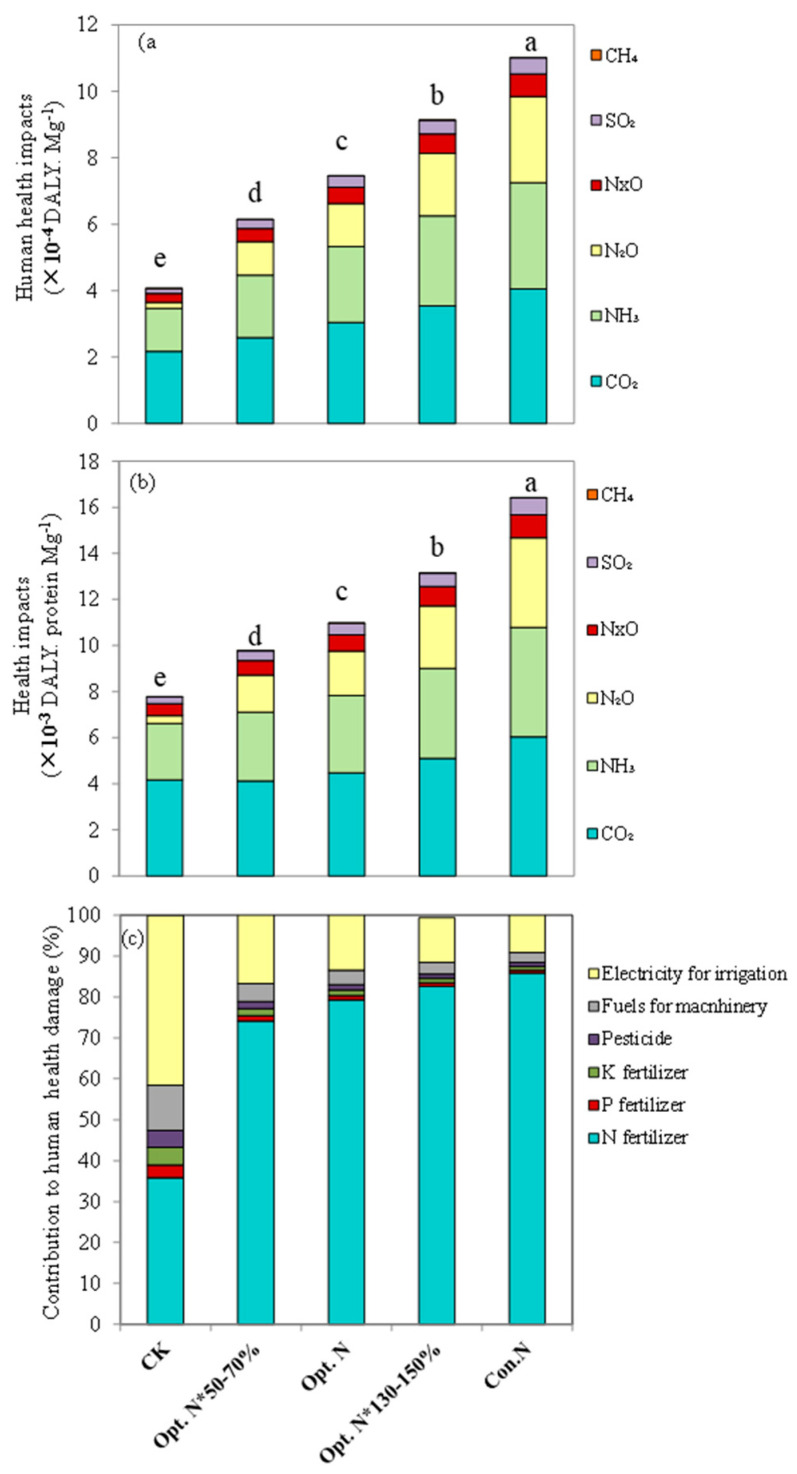
Figure 5.
Average human health effects per Mg of maize grain produced (a) and per Mg of maize grain protein produced (b) and contributions of agricultural materials input to the human health effect (c) under five N treatments during the years 2008–2019 of the experiment. CK, no N; Opt. N*50–70%, 50–70% of optimal N rate; Opt. N, optimal N rate; Opt. N*130–150%, 130–150% of optimal N rate; Con. N, conventional N rate. Values are means of 12 growing seasons (n = 48). Means followed by the same lowercase letter are not significantly different among five N treat-ments at p < 0.05 according to LSD.

