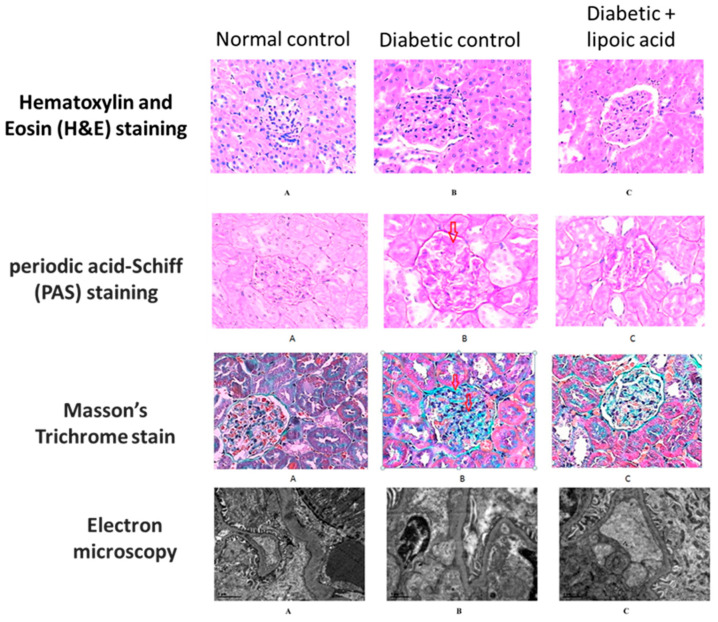
Figure 5.
Protective effects of lipoic acid on diabetic kidney disease. Histological staining of the kidney tissues derived from control, diabetic, and diabetic + lipoic acid treatment. This figure was reproduced from reference [55]. For all the microscopic images, the amplification magnitude is ×800. (A) normal control group; (B) diabetic control group; (C) diabetic + ALA group. Glomerular hypertrophy, mesangial region expansion, proliferation of mesangial cells, and inflammatory cell filtration could also be observed in H&E staining. Disruption of glomerular basement membrane and mesangial region expansion could also be observed in PAS staining. Additionally, collagen fiber staining shows an increased intensity in the diabetic control group but exhibits a significant decrease in ALA-treated animals. For PAS staining, the red arrow indicates thickening and deformation in the glomerular basement membrane in the diabetic kidney. For Masson’s stained sections, the red arrows indicate the increased intensity of collagen fiber stain in the diabetic kidney.

