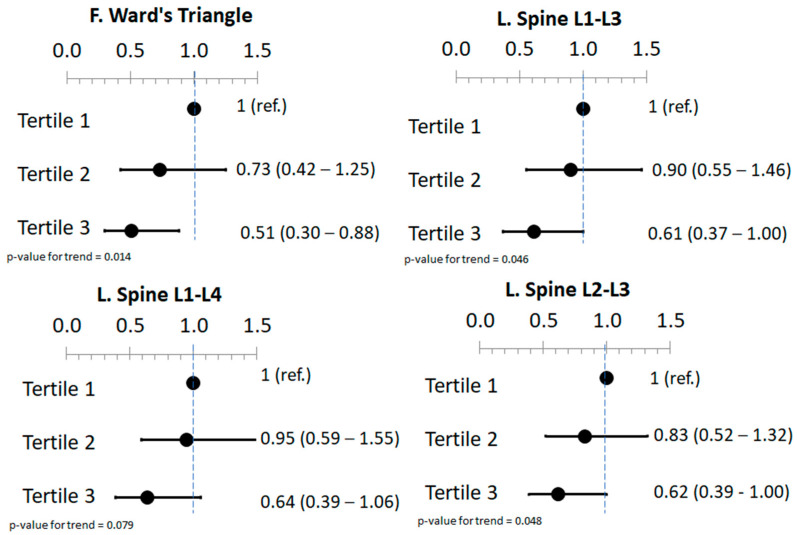
Figure 1.
Forest plot of low bone mineral density (T-score ≤ −1) and tertiles of estimated phytate intake. Values are expressed as the adjusted odds ratio (95% CI). Models were adjusted for age (years), BMI (kg/m2), physical activity (MET•min/week), educational level (higher education/technician or secondary education/primary education or less), smoking status (never/former/current), type 2 diabetes prevalence, osteoporotic fractures prevalence, energy (kcal/day), calcium (mg/day), vitamin D (µg/day), glycemic index, vegetables and fruits (g/day). This figure is a summary of the Supplementary Table S1.

