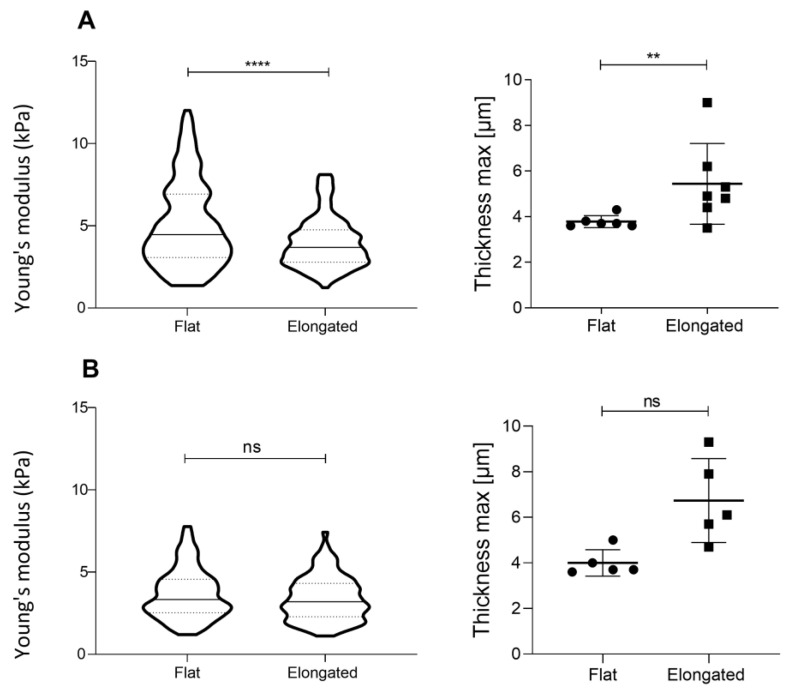
Figure 9.
Young’s modulus dependence on cell shape. (A) Example of cell line showing differences in cell shape correlating with elasticity values and cell thickness (line 1). (B) Example of a cell line where differences in shape do not imply diverse thicknesses, thus showing stable stiffness (line 2). The statistical analysis relies on the non-parametric Kolmogorov–Smirnov test (****p < 0.0001; **p < 0.01).

