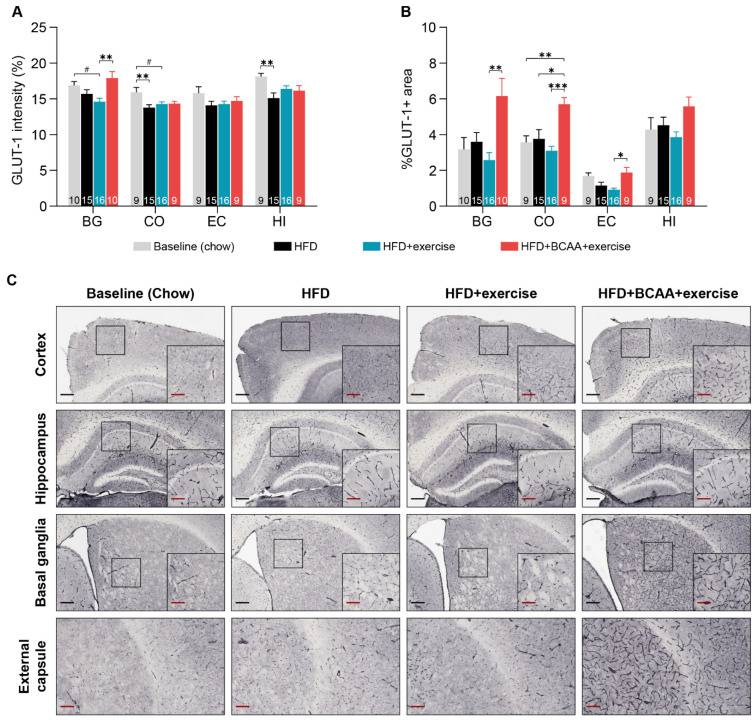
Figure 9.
Cerebrovascular integrity. Immunohistochemical analysis of glucose transporter 1 (GLUT-1) as a measure of cerebrovascular integrity in different brain regions of interest (basal ganglia (BG), cortex (C), external capsule (EC), and hippocampus (HI)). (A) GLUT-1 staining intensity is a measure of the amount of GLUT-1 in the capillaries. (B) The percentage of GLUT-1 positive staining per area is representative of vascular density. (C) Representative images of the GLUT-1 staining (black scale bar = 200 µm; red scale bar = 100 µm). Group differences between young chow-fed animals (baseline), HFD, HFD + exercise, and HFD + BCAA + exercise groups were analyzed. High-fat diet (HFD), branched-chain amino acids (BCAA). Data are presented as mean ± SEM. * p < 0.05, ** p < 0.01, *** p < 0.001, # 0.05 < p < 0.08 (trend).

