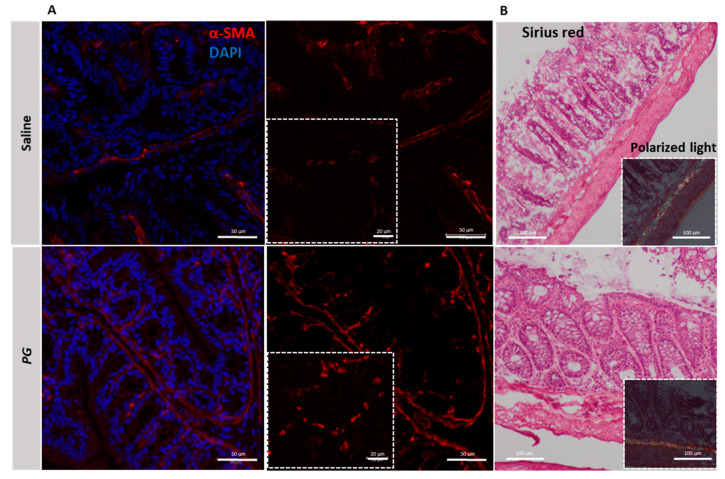
Figure 5.
PG-activated fibroblasts during the recovery phase of acute colitis. (A) Representative immunofluorescence staining of α-SMA (red) in the colonic section of colitic mice in resolution phase treated with saline or PG. DAPI = nuclei in blue. Scale bar = 50 µm; Scale bar magnification = 20 µm. (B) Sirius red staining and polarized light microscopy showing the collagen deposition and the different collagen fibers (green, yellow, and red), respectively, in the colonic mucosa of colitic mice during the resolution phase subjected to saline or PG treatment. n = 3 mice/group. Scale bar = 100 µm.

