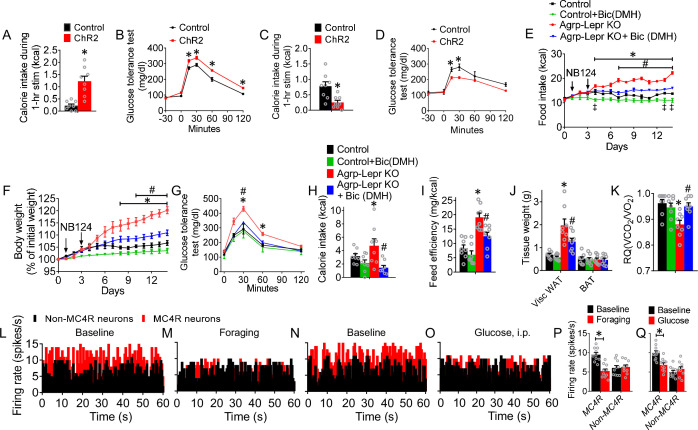
Figure 4. The leptin-responsive AgRP-DMH circuit regulates feeding, body weight, and glucose tolerance.
(A,B) 1-hr food intake (A) and GTT (B) after photostimulation of the AgRP→DMH circuit. (n=8 per group; *p<0.05). (C,D) 1-hr refeeding test (C) and GTT (D) after photostimulation of the MC4RDMH neurons. (n=8 per group; *p<0.05). (E–G) Daily food intake (E), body weight (F) and GTT (G) in control mice, Agrp-Lepr KO mice with Bic or vehicle injected into the DMH. The saline or Bic (4 ng; 0.25 μl/hr) was chronically infused into the DMH via the osmotic minipump for 14 days. (n=8 per group; *p<0.05 between Control and Agrp-Lepr KO, #p<0.05 between Agrp-Lepr KO and Agrp-Lepr KO +Bic(DMH), ‡p<0.05 between Control and Control +Bic(DMH)). (H) 4-hr food intake in the mice described in E-G on day 14. (I) Feed efficiency in the mice described in E–G. (J) Weight of adipose tissues in the mice described in E–G on day 14. (K) Average value for RQ (VCO2/VO2) in the mice described in E–G on day 14. (n=8 per group in H–K; *p<0.05 between Control and Agrp-Lepr KO, #p<0.05 between Agrp-Lepr KO and Agrp-Lepr KO +Bic(DMH)). (L–O) Firing rate of representative MC4RDMH neurons and non-MC4RDMH neurons when mice under baseline (satiation) (L, N), foraging (prior to meal initiation) (M), and glucose i.p. injection (well-fed state) (O). The statistical analysis of the firing rate under baseline, foraging (P), and glucose treatment (Q) were calculated. (n=10 neurons from 3 mice in each group; *p<0.05). Error bars represent mean ± SEM. unpaired two-tailed t test in A, C, P and Q; one-way ANOVA and followed by Tukey comparisons test in H–K; two-way ANOVA and followed by Bonferroni comparisons test in B and D–G.


