
Figure 5. The α3-GABAA receptor signaling within the MC4RDMH mediates feeding and glucose tolerance.
(A) Expression level of Gabra1- Gabra6 in the DMH neurons of control and Agrp-Lepr KO mice. (B) Immunostaining showing the expression of GABAA α3 in the DMH. Scale bar, 100 μm. (C–E) Colocalization of GABAA α3 and transsynaptically labeled neurons by WGA-ZsGreen in the DMH after injection of AAV9-DIO-WGA-ZsGreen into the ARC of AgrpCremice. Scale bar in E for C–E, 50 μm. (F–H) The food intake (F), body weight (G), and GTT (H) were performed in Mc4rCre::Rosa26fs-Cas9 mice with a bilateral injection of vehicle, AAV9-Gabra3sgRNA-tdTomato (GABAA-α3 KO), or AAV9-DIO-Gabra3cDNA-EYFP (GABAA-α3 OE) into the DMH. (I) Feeding efficiency in the mice described in F–H. (J) Weight of adipose tissues in the mice described in F–H. n=8 per group in F–J; *p<0.05 between Control and GABAA-α3 KO, #p<0.05 between Control and GABAA-α3 OE. (K–O) The food intake (K), body weight (L), GTT (M), feeding efficiency (N), and weight of adipose tissues (O) were performed in control mice and GABAA-α3 OE mice followed by the microinjection of leptin into ARC. (n=8 per group in K-O; *p<0.05 between Control +leptin and GABAA-α3 OE +leptin). (P–R) The 24-hr food intake (P), body weight change (Q), and refeeding test (R) were performed in HFD-treated with or without knockout of GABAA-α3. (n=8 per group; *p<0.05). Error bars represent mean ± SEM. unpaired two-tailed t test in A and N–R; one-way ANOVA and followed by Tukey comparisons test in I and J; two-way ANOVA and followed by Bonferroni comparisons test in F–H and K–M. (S) Diagram showing a leptin regulated GABAergic neural circuit reverses obesity. The GABAergic AgRPLepR→DMH circuit plays a critical role in control of leptin-mediated food intake, body weight, and glucose tolerance through the α3-GABAA signaling within the MC4RDMH neurons.

Figure 5—figure supplement 1. Quantification of gabra3 transcription levels in the DMH by qPCR 21 days after injection of AAV9-Gabra3sgRNA-tdTomato into DMH of Mc4rCre::Rosa26fs-Cas9 mice (A) or injection of AAV9-DIO-Gabra3cDNA-EYFP into DMH of Mc4rCre mice (B).
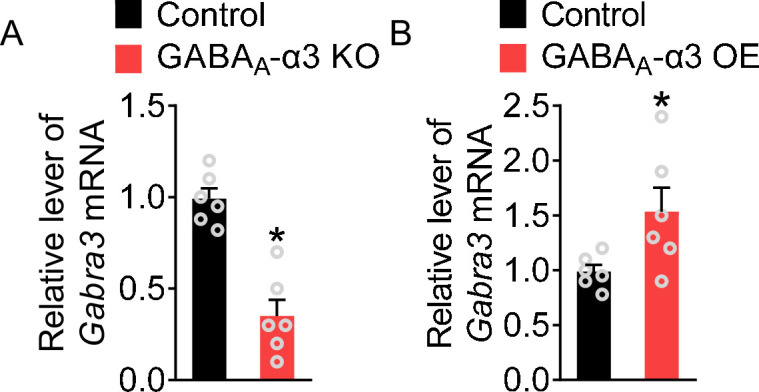
Figure 5—figure supplement 2. The AgRP-DMH circuit regulates feeding and glucose tolerance depending on the α3-GABAA receptor signaling in the MC4RDMH neurons.
