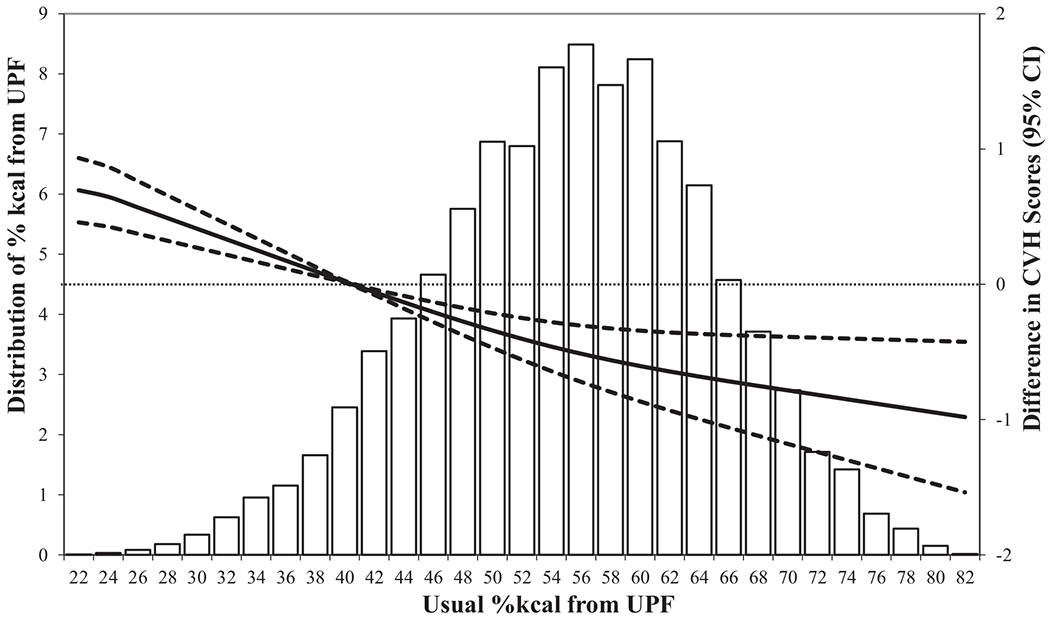
FIGURE 1.

Distributions of usual %kcal from UPFs and adjusted differences in CVH scores (40.4% as reference), US adults (n = 11,246), NHANES 2011–2016. Multivariable linear regression models were used to estimate the adjusted differences in CVH scores and corresponding 95% CI, and were adjusted by age, sex, race and Hispanic origin, education, and poverty-to-income ratio. CVH, cardiovascular health (excluding diet component); UPF, ultraprocessed food; %kcal, percentage of calories.
