
Figure 1. Single-cell transcriptomic cell atlas of human OA synovium.
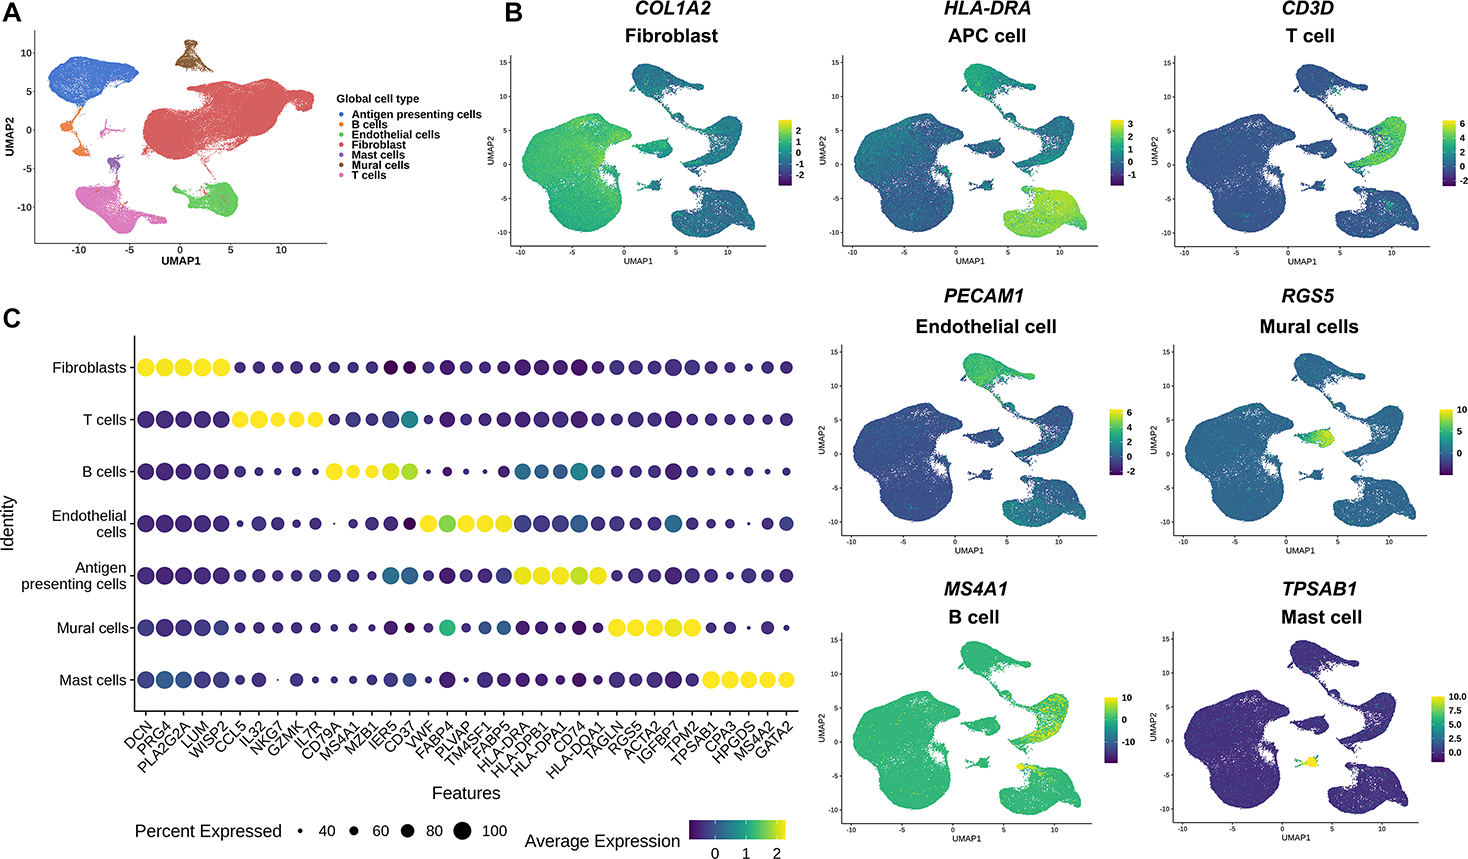
(A) UMAP plot of scRNA-seq showed unsupervised clusters colored according to putative cell types among a total of 93,208 cells in OA synovium. 59%, 13.6%, 11.4%, 10%, 3%, 1.8% and 1% of total acquired cells were fibroblast, APC cells, T cells, endothelial cells, mural cells, B cells and mast cells. (B) Expression of the selected top marker genes for each cell type is shown in UMAP plots. (C) Expression level of the top 5 feature genes in seven distinct cell types is mapped in dot plots (Color stands for the average expression of each gene and the size stands for percent expressed). OA, osteoarthritis; UMAP: Uniform manifold approximation and projection; ST, synovial tissue; APC, antigen presenting cell.