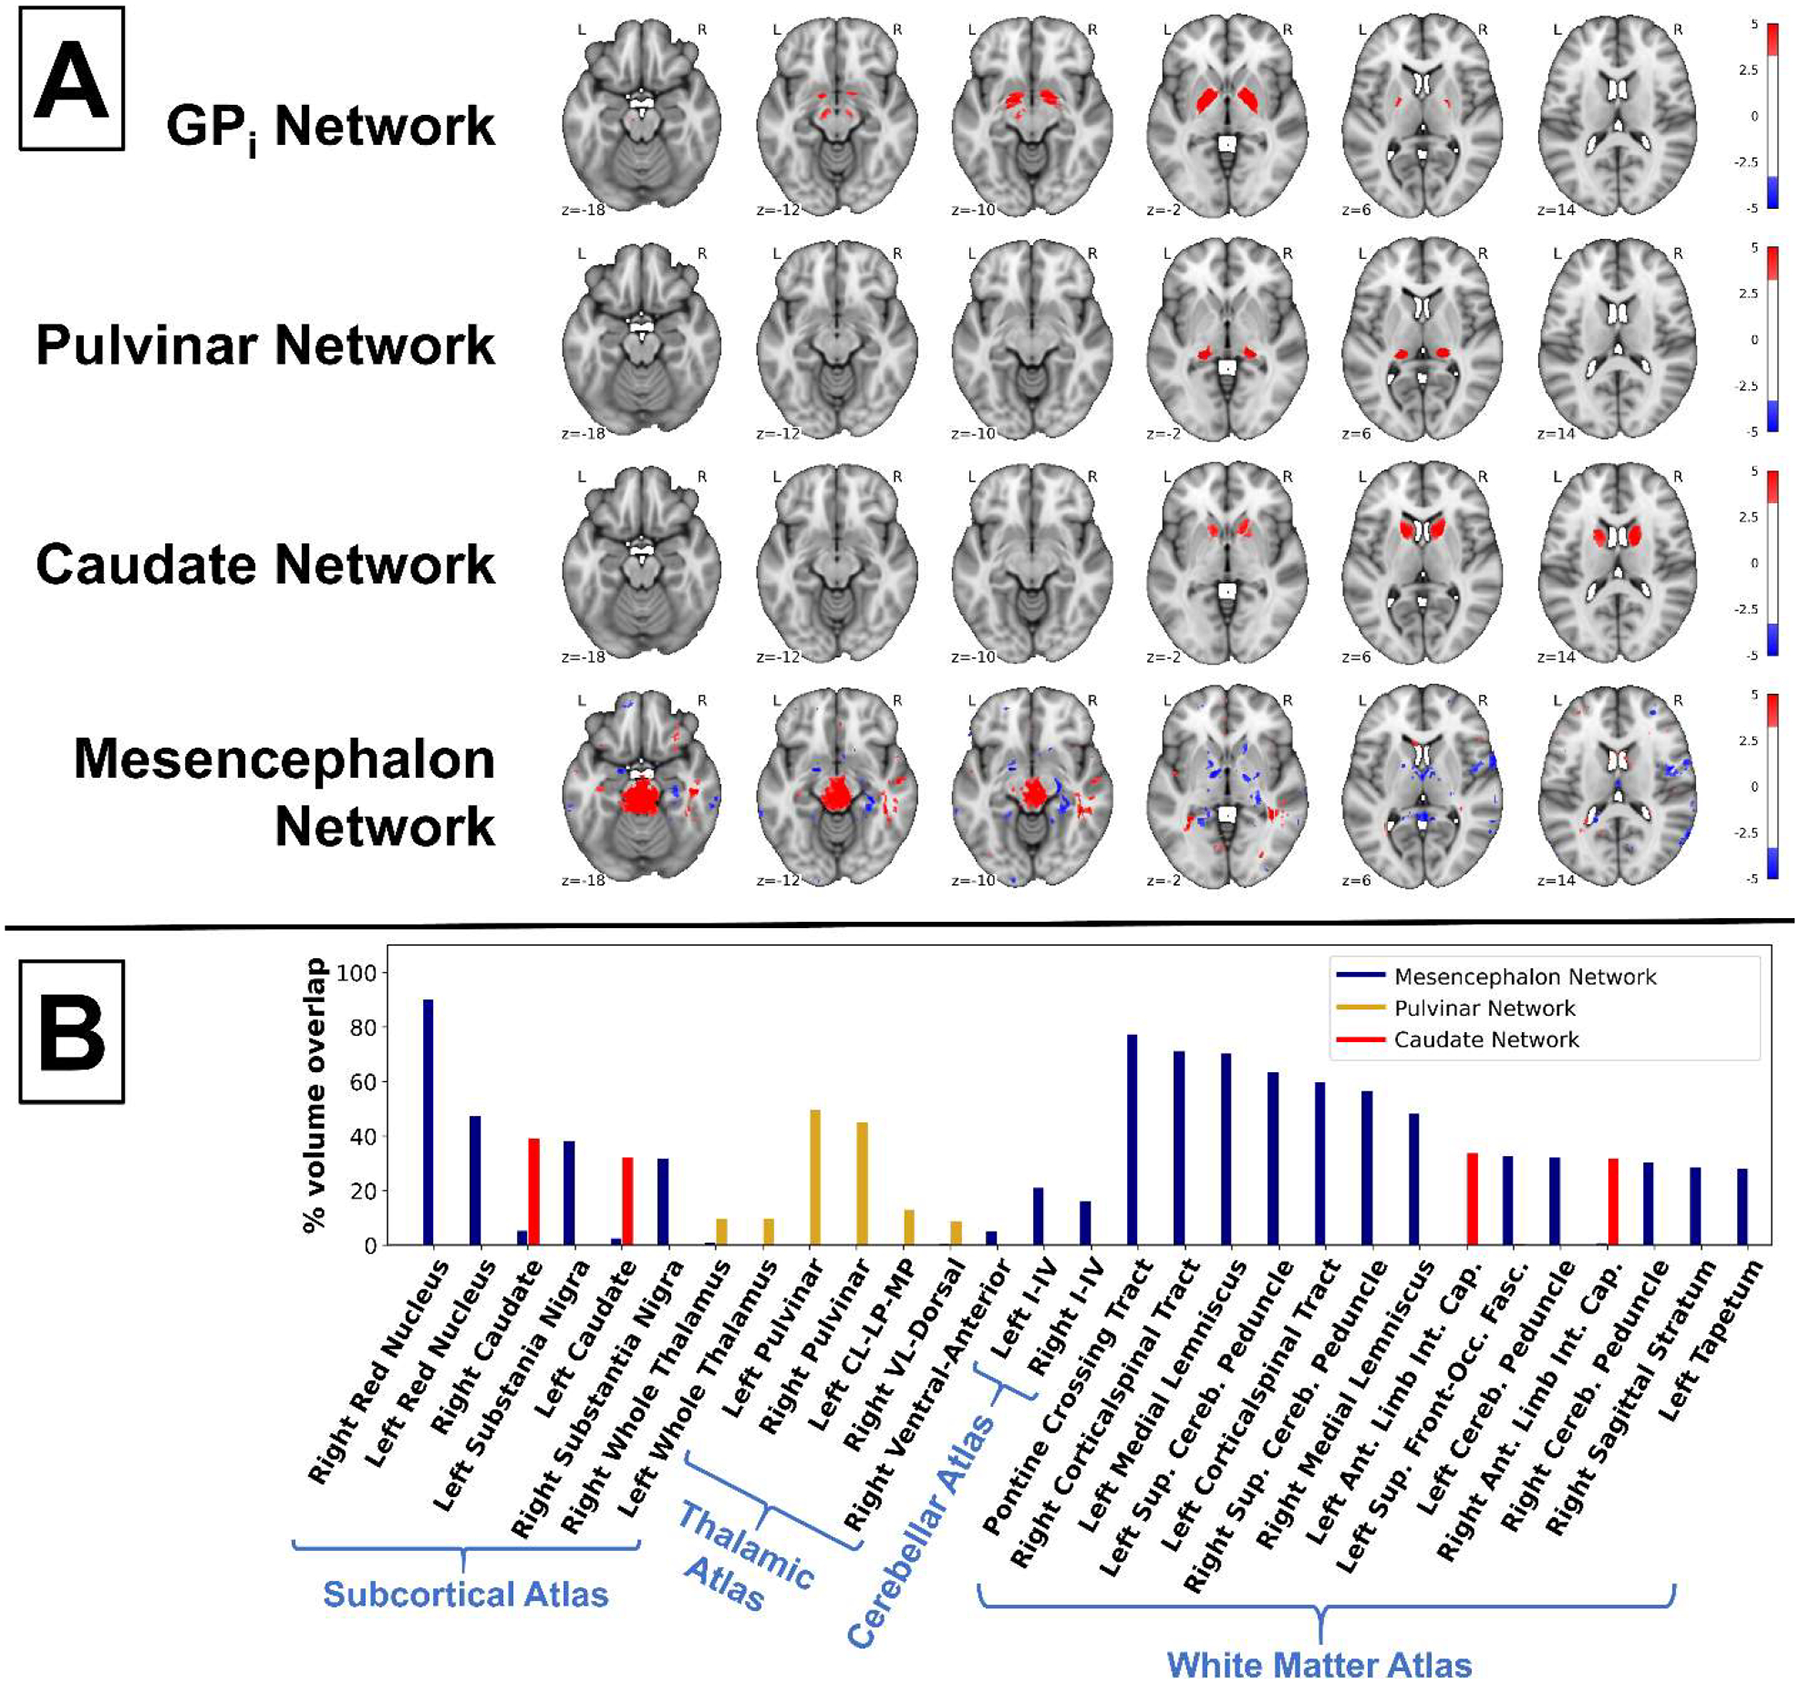
Figure 6. MS networks and their anatomical representations.

(A) Axial slices of the networks derived from the MS/HC cohort that had a significant main effect of disease status. Image threshold: |Z| > 3.3, corresponding to P < 0.001 two-tailed voxel-wise t tests, uncorrected. (B) Bar graph showing the percent volume overlap of additional disease-related MS/HC networks and anatomical regions (threshold: |Z| > 3.3). Only areas with > 5% overlap by volume are shown. Ant. = anterior; CL-LP-MP = central-lateral, lateral-posterior, and medial-pulvinar;
