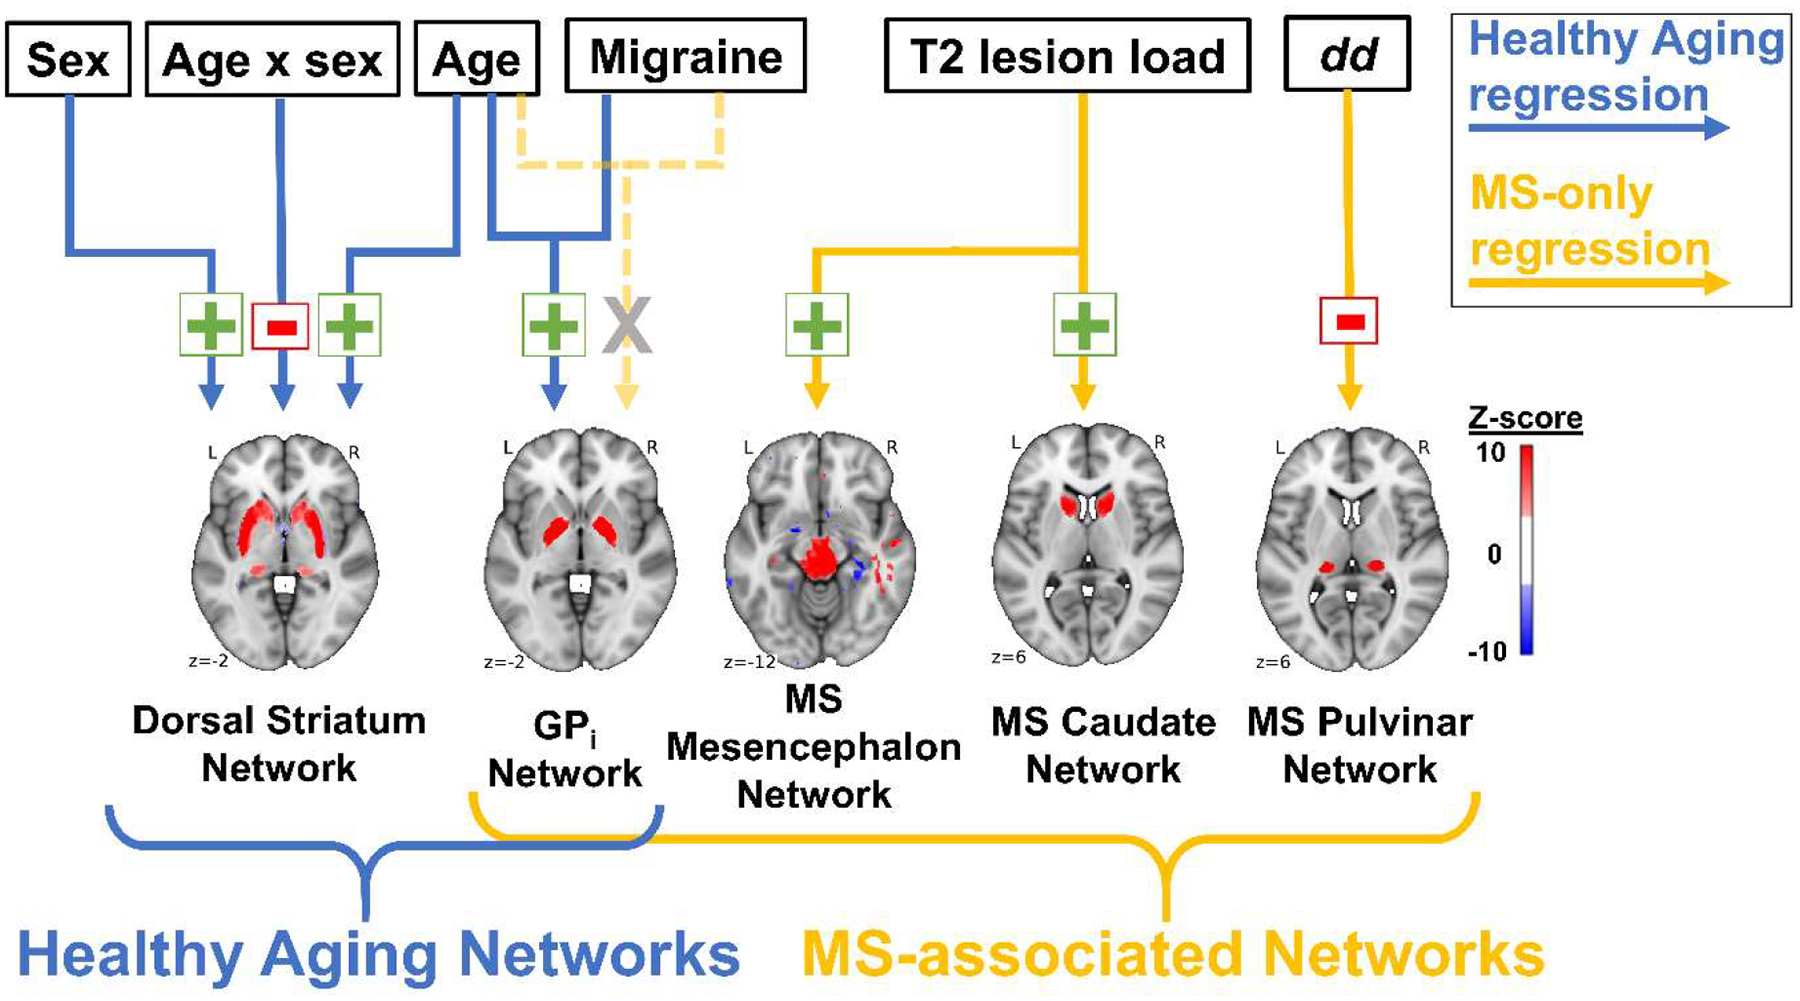
Figure 7. Diagram of the factors associated with the HA Networks and MS Networks.

Associations are shown separately for the HA cohort regression (blue arrows) and MS-only regression (gold arrows). Green plus sign = positive association; red negative sign = negative association; grey “X” = no association in MS cohort only.
