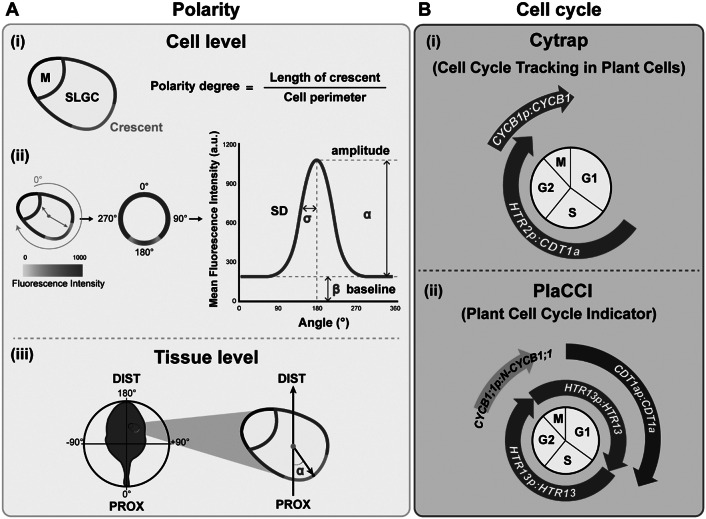
Fig. 3.
Quantitative tools for measuring polarity and the cell cycle. (A) Polarity measurements. (i) The polarity degree is calculated by the crescent length (green) relative to the cell perimeter (green+pink). M: meristemoid. SLGC, stomatal lineage ground cell. (ii) Workflow for Polarity Measurement (POME), a Fiji-based semi-automated pipeline for polarity quantification: First, a line of 0° to 180° angle is defined by the centroid to the centre of polar protein mass. Second, the cell outline is reconstructed and visualised by quantification of the fluorescence intensity. Third, standard deviation (SD,
 ), amplitude (
 ), and baseline intensity (
 ) derived from the fluorescence intensity through Gaussian fitting quantify the degree of polarisation in the plasma membrane, with higher SD values representing higher polarity levels. (iii) Tissue-wide polarity orientation can be indicated by the angle (α) between the leaf midrib and the connection between the cell centroid (orange dot) and the midpoint of the polarity crescent. (B) Cell cycle measurements. (i) Cytrap (Cell cycle tracking in plant cells) line. The dual-colour cell cycle reporter line uses HTR2pro:CDT1a-RFP and CYCB1pro:CYCB1-GFP to indicate S/G2 and G2/M, respectively. (ii) PlaCCI (Plant Cell Cycle Indicator) line. The three-colour cell cycle reporter line adopted CDT1apro:CDT1a-CFP, CYCB1:1pro:CYCB1;1-YFP, and HTR13pro:HTR13-mCherry to indicate G1, G2/M, and the entire cell cycle, respectively.

