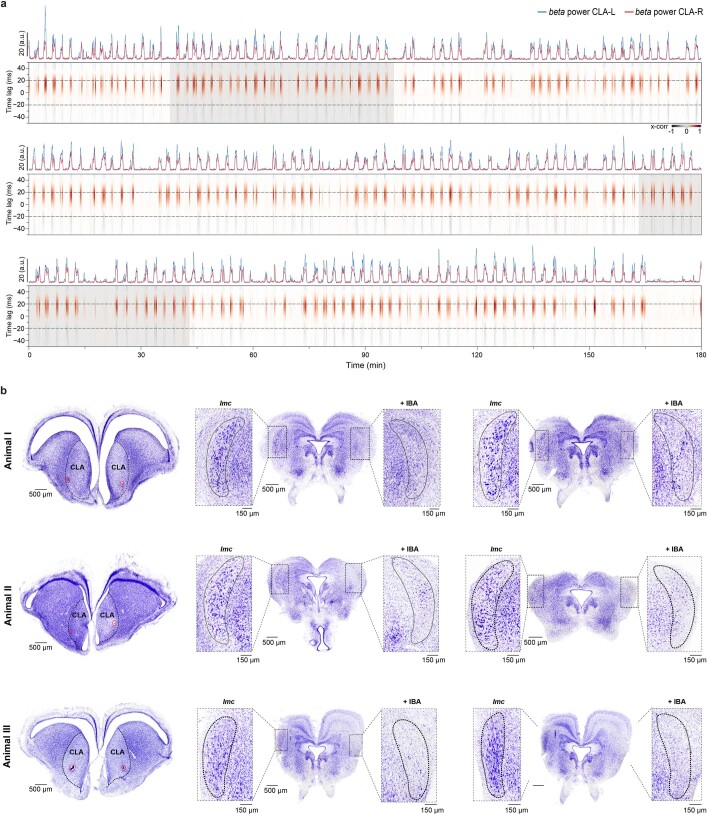
Extended Data Fig. 8. Further characterization of Imc lesions.
a, Unilateral Imc lesion. Shown are the cross-correlations between left and right claustra for 9 h of sleep, together with the normalized beta power for both claustra above. Shaded areas indicate the time periods shown in Fig. 5c. b, Nissl stains of transverse sections at the level of the claustrum (left column) and the Imc (middle and right column), for three animals with unilateral IBA-induced lesions. Note the Imc lesions and cell-body loss after injection of IBA, and the recording sites in the claustra, as identified by electrolytic lesions (red stippled line).

