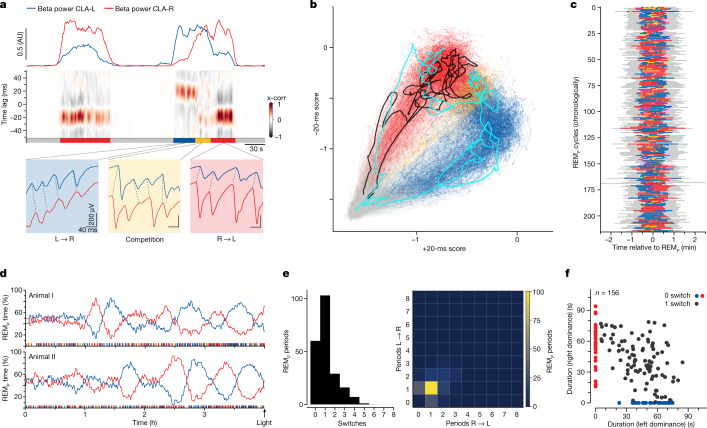
Fig. 3. Dominance switching obeys slow dynamics.
a, Detailed temporal relationship between left and right SNs during two REMP cycles. Blue shading, left leads. Red shading, right leads. Yellow shading, leading side not established; corresponds to time when beta-band powers are balanced (top traces). b, Dynamics of bilateral correlations plotted in a space defined by an instantaneous metric of temporal leadership (see Methods). Along x, left leads; along y, right leads. Each line represents one REMP cycle, starting from the grey area (−1.5, −1.5), which corresponds to SW sleep. Details in the main text. c, Plot of the fraction of time spent in each state (colours as in a,b) over 220 successive sleep cycles. d, Fraction of REMP time that each side spends leading in the four final hours of sleep (two animals). Note the long cycles, corresponding to many (more than ten) sleep cycles, of one-sided dominance tendency. e, Frequency distribution of leading-side switches per REMP episode. Left, distribution of total numbers of switches. Right, distribution of number of periods of dominance per REMP cycle. f, Duration of REMP episodes, separating those with one switch (black) from those with none (colours). When a REMP episode contains one switch, the mean total duration of the episode (value in x plus corresponding value in y for all black dots) approximates 90 s on average versus 60 s on average for episodes with no switch.

