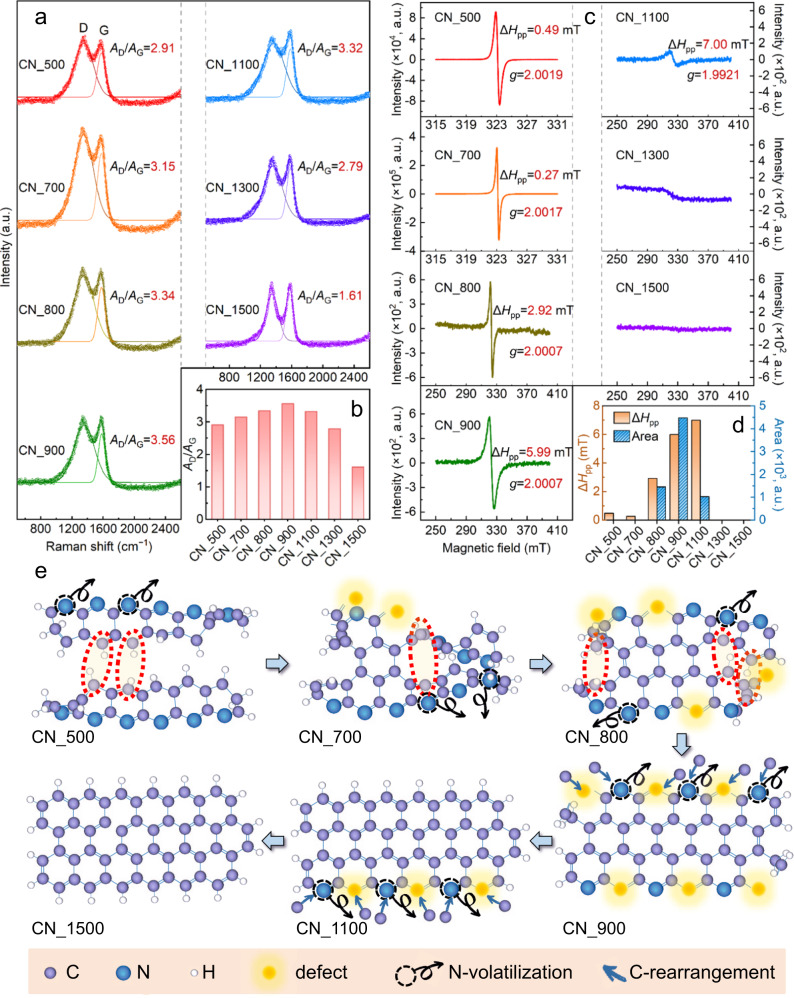
Fig. 3. Disclosing the generation, evolution, and annihilation of defects.
a Raman spectra and fitted peak curves of the CN_500, CN_700, CN_800, CN_900, CN_1100, CN_1300, and CN_1500. b Comparison of the AD/AG ratio calculated from Raman spectra. c ESR spectra of the different CNs. d Comparison of the calculated ESR signal widths (ΔHpp) and areas among the different CNs. e Proposed atomic structure variation during the thermal tuning process, illustrating the gradual annulation (resulting in ring structures), N volatilization (resulting in defects), and graphitization (reducing defects and lattice disorder) processes.

