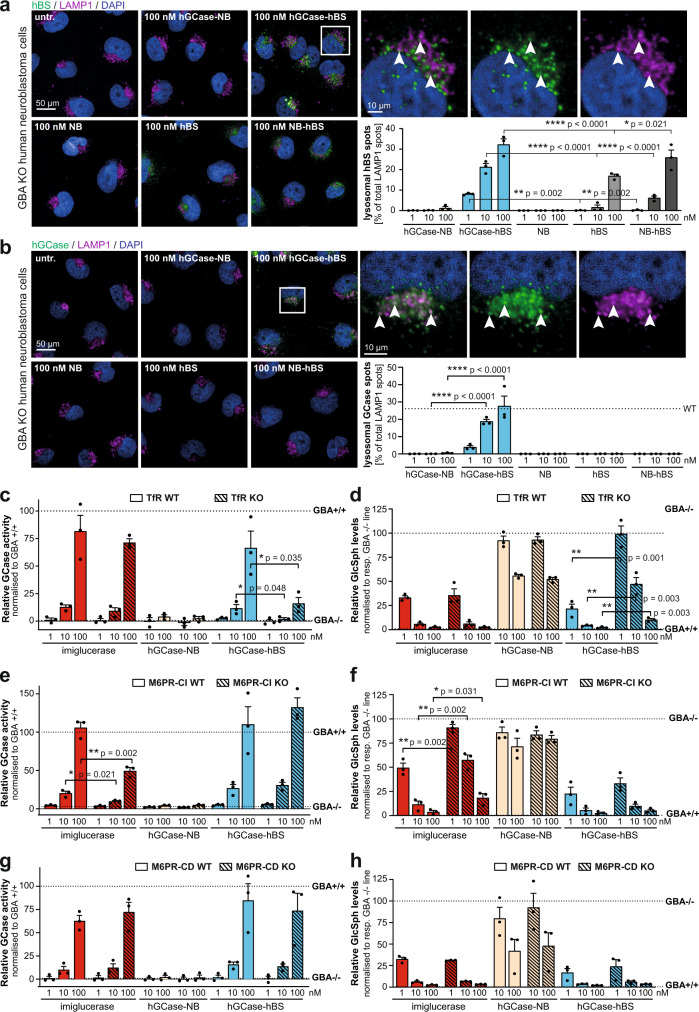
Fig. 4. GCase-BS lysosomal mode of action in vitro.
a Immunolabeling of hBS and colocalisation with LAMP1 upon acute treatment with various constructs. White arrows indicate some colocalising spots. Colocalising hBS spots were quantified and normalised to total amount of LAMP1 spots. n = 3. b Immunolabeling of hGCase and colocalisation with LAMP1 upon acute treatment with various constructs. White arrows indicate some colocalising spots. Colocalising GCase spots were quantified and normalised to total amount LAMP1 spots. n = 3. c Total GCase activity in GBA-deficient TfR WT and TfR KO neuroblastoma lines as a measure of cellular uptake after 2 h of treatment. Data was normalised to GB+/+ cells. n = 3. d GlcSph measurement in GBA-deficient TfR WT and TfR KO neuroblastoma lines upon 48 h of treatment. Data was normalised to respective GBA−/− cells. n = 3. e Total GCase activity in GBA-deficient M6PR-CI WT and M6PR-CI KO neuroblastoma lines as a measure of cellular uptake after 2 h of treatment. Data was normalised to GBA+/+ cells. n = 3. f GlcSph measurement in GBA-deficient M6PR-CI WT and M6PR-CI KO neuroblastoma lines upon 48 h of treatment. Data was normalised to respective GBA−/− cells. n = 3. g Total GCase activity in GBA-deficient M6PR-CD WT and M6PR-CD KO neuroblastoma lines as a measure of cellular uptake after 2 h of treatment. Data was normalised to GB+/+ cells. n = 3. h GlcSph measurement in GBA-deficient M6PR-CD WT and M6PR-CD KO neuroblastoma lines upon 48 h of treatment. Data was normalised to respective GBA−/− cells. n = 3. Bar graphs represent group means + SEM. Each data point represents an independent measurement. Data were analysed by Student’s two-tailed t-test comparing WT and KO of each receptor for each treatment. *p < 0.05; **p < 0.01; ***p < 0.001. If not stated otherwise, n = number of independent measurements. Source data are provided as a Source Data file.

