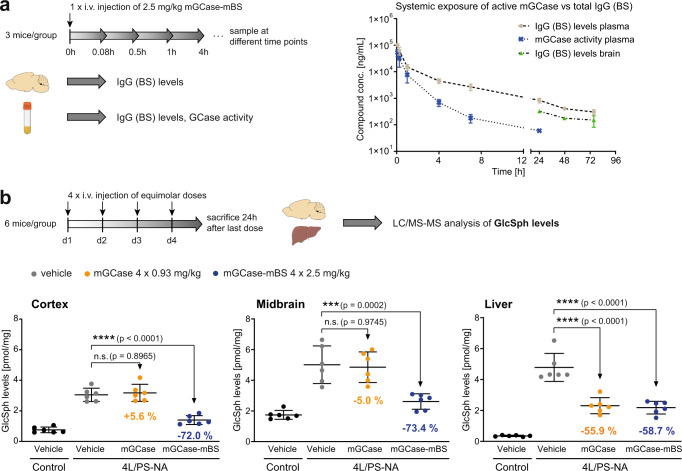
Fig. 6. GCase-BS proof of concept in vivo.
a PK study in Gba+/+ mice to assess systemic exposure of mGCase-mBS in plasma and brain. n = 3 mice/group. b Multi-dose PD study in 4 L/PS-NA mice to compare equimolar doses of mGCase vs. mGCase-mBS. GlcSph levels were measured in cortex, midbrain and liver. n = 6 mice/group. Data are represented as group mean +/− SEM. Data was analysed by one-way ANOVA (Dunnett’s multiple comparisons test) comparing each treatment group to 4 L/PS-NA, vehicle. n.s. p > 0.05; ****p < 0.0001. Source data are provided as a Source Data file. Schematics created with BioRender.com.

