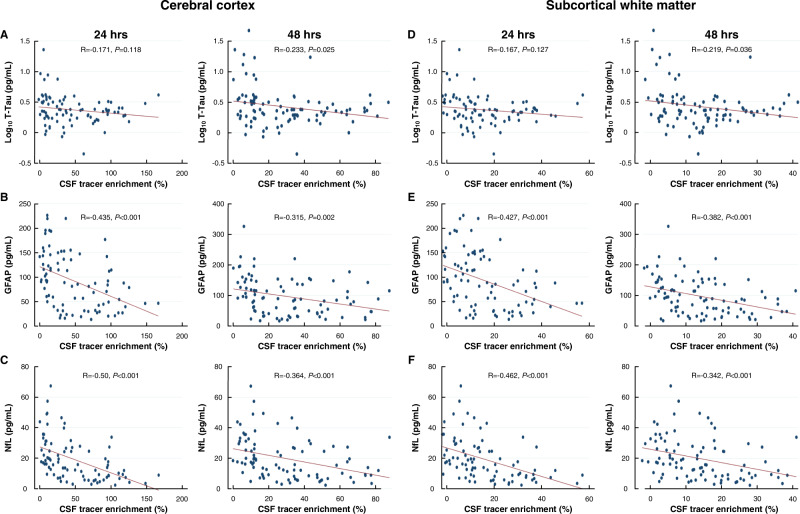
Fig. 2. Association between plasma concentrations of neurodegeneration biomarkers and enrichment of CSF tracer within the cerebral cortex and subcortical white matter of the entire cohort (n = 106).
Plots of associations between tracer enrichment in the cerebral cortex at 24 h and average plasma concentrations of A T-tau (log10 T-tau), B GFAP, and C NfL. Plots for associations between tracer enrichment in subcortical white matter at 24 and 48 h and average plasma concentrations of D T-tau, E GFAP, and F NfL Each scatter plot shows the linear fit line, including Pearson correlations and significance levels. Source data are provided as Source Data file.

