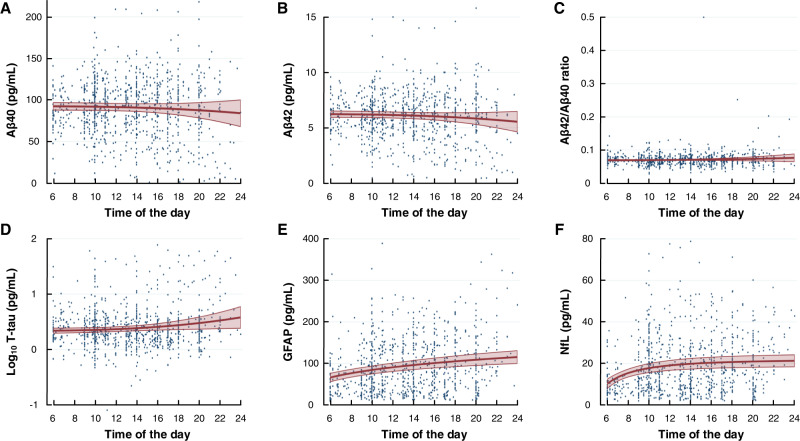
Fig. 5. Daytime variation in plasma biomarker concentrations within the entire cohort (n = 106).
Biomarker concentrations in longitudinally collected plasma samples showed no difference over time for A Aβ40 (P = 0.348), B Aβ42 (P = 0.185), or C Aβ42/ Aβ40 ratio (P = 0.309). Increasing plasma concentrations toward evening was shown for D Log10 T-tau (P = 0.031), E GFAP (P < 0.001), and F NfL (P < 0.001; fractional polynomial regression analysis with robust standard error for repeated measurements). Results presented as mean (red line) with 95% confidence intervals (red shaded area), including individual data points. Source data are provided as Source Data file.

