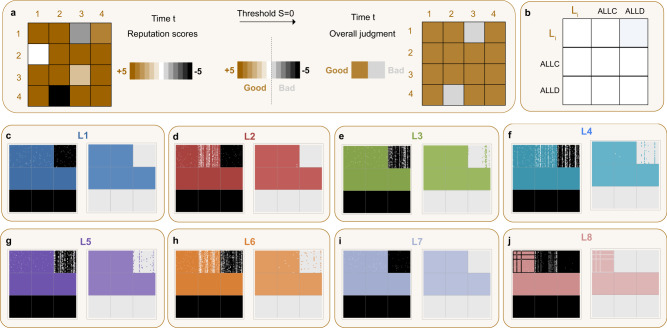
Fig. 2. Quantitative assessment and reputation dynamics.
a Image matrices represent how players assess each other at any given time. We assume that every player keeps track of each population member’s reputation score, with scores in the interval [− 5, + 5]. To depict these image matrices graphically, we use colored dots, with the intensity of the color corresponding to the score: for example, a white dot means that the corresponding row player attributes a score of r = 0 to the corresponding column player (left side). On the other hand, players also make an overall judgment of others, in order to be able to use their assessment and action rules. To do so, they compare the scores to a threshold S = 0, resulting in a binary labeling of “good” and “bad”. To visualize this second, less refined layer of the reputation dynamics, we use a matrix with colored and gray dots (right side). b We show image matrices when players either use a leading eight social norm Li, ALLC, or ALLD (in equal proportions). c–j We show the snapshots at T = 2 × 10⁶ of players’ reputation scores and binary labels they translate into for all leading eight norms. We see that for L1 (c) and L7 (i), the reputation assignments of different Li players are perfectly correlated. They assign only good reputations to each other and ALLC, while they only assign bad reputations to ALLD. The picture is very similar for L2 (d). For all other norms, there are disagreements among the Li players, where they can also perceive ALLD players favorably. We note that L8 does not perceive any ALLC player as good, which is one of two very stable states in the reputation dynamics. Parameters: Population size N = 90, error rate ε = 0.05, observation probability q = 0.9, frame of reference R = 5 (i.e., interval for reputation scores r ∈ [− 5, 5]). Threshold S = 0. Simulations are run for 2 × 10⁶ iterations, and the initial image matrix assumes a good reputation for all players.

